The climate change predictions from IPPC predict temperatures of 1.5o would be passed by 2050 under the net zero scenario, but recent scary climate change research news demonstrates much higher temperature rises (2o +). Additionally, tipping points such as AMOC are highly likely by 2050. Land temperatures have already passed 1.5o above preindustrial highs.
Some climate researchers say the true situation is orders of magnitude worse than the public thinks it is. Consensus science and scientists have been captured for decades by fossil fuels, and the IPPC report is moderated to gain consensus.
In reality, we are in astronomical carbon debt. There is much debate between climate scientists, often heated. The disagreement appears to be the result of the Earth’s energy imbalance (EEI) and consequences. On one side are climate scientists such as Mann and members of the IPPC science reviewers, who say 1.5o by 2050 is still achievable, and others, sometimes called “doomers”, including Hansen, Leon James, Bendell, and Prof Eliot Jacobson). These scientists say the EEI means 1.5o will be reached in the 2030’s, and 2o or more by early 2040’s.
Climate Change Models are Complex
Climate models are very complex, and understandably there is disagreement.
Uncertainties are very large, which might be the main problem. We don’t know how bad it will get, and anyone who tells you one way or another is lying.
Dr Leon James, Board, Club of Rome. (on his profile)
Why was 2023 so extreme?
- The world absorbed a lot more sunlight, as less was reflected.
- Greenhouse gases kept most of the additional heat in.
- Add El Niño and all temperature records shattered!
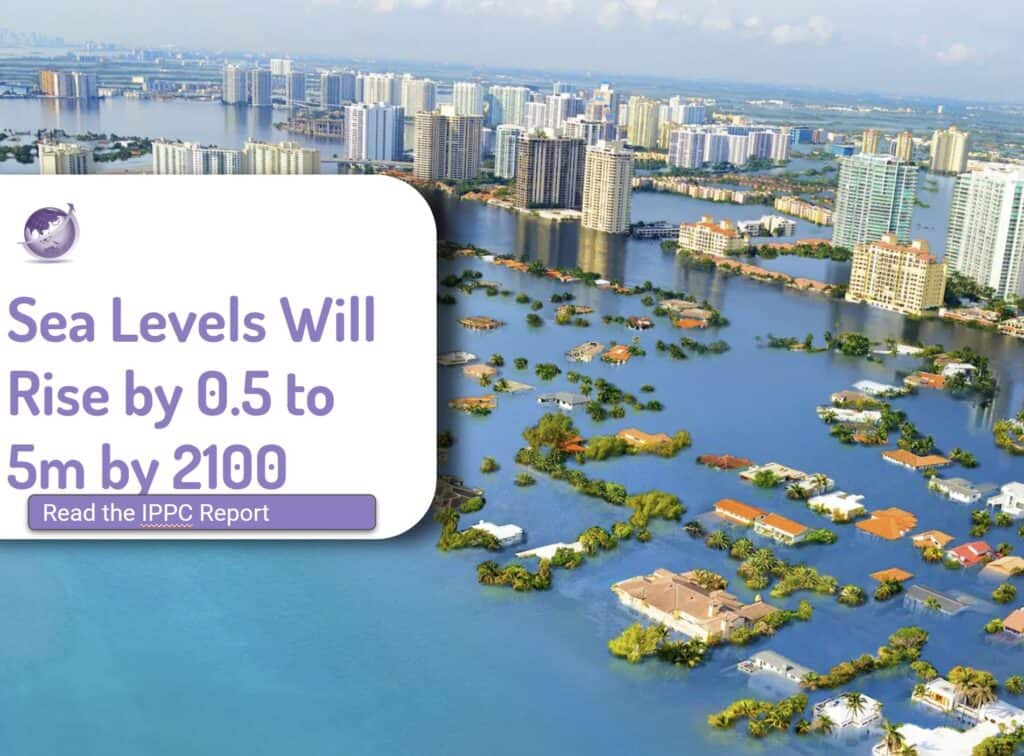
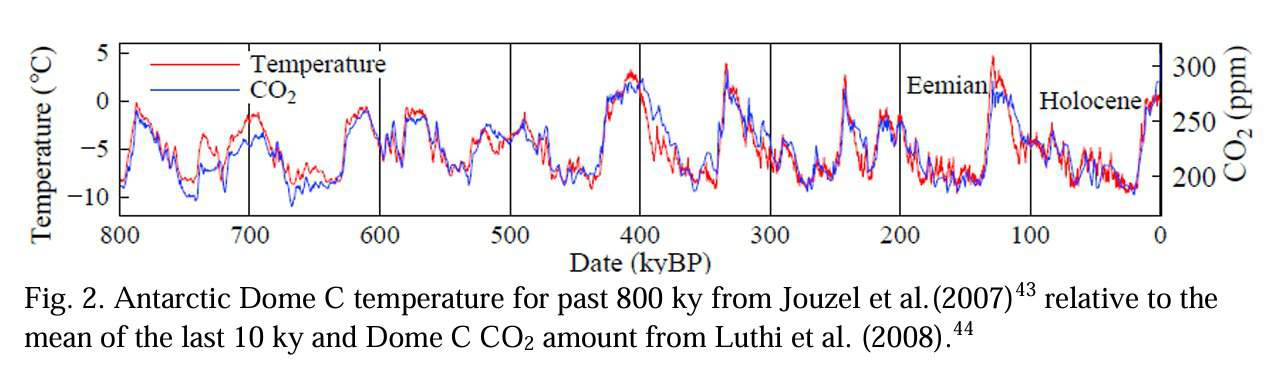
Global warming of at least 2°C is now baked into Earth’s future, and by midcentury or earlier. It is now certain that Earth will soon be warmer than it was during the Eemian period. The Eemian, the prior interglacial period that lasted from about 130,000 to 115,000 years ago, was the most recent time that Earth was warmer than it has been during the present (Holocene) interglacial period. Hansen [6] expects land temperature to be 3o to 4o if the global temperature average is 2o. This period saw sea levels 6 to 9 metres higher than the current Holocene.
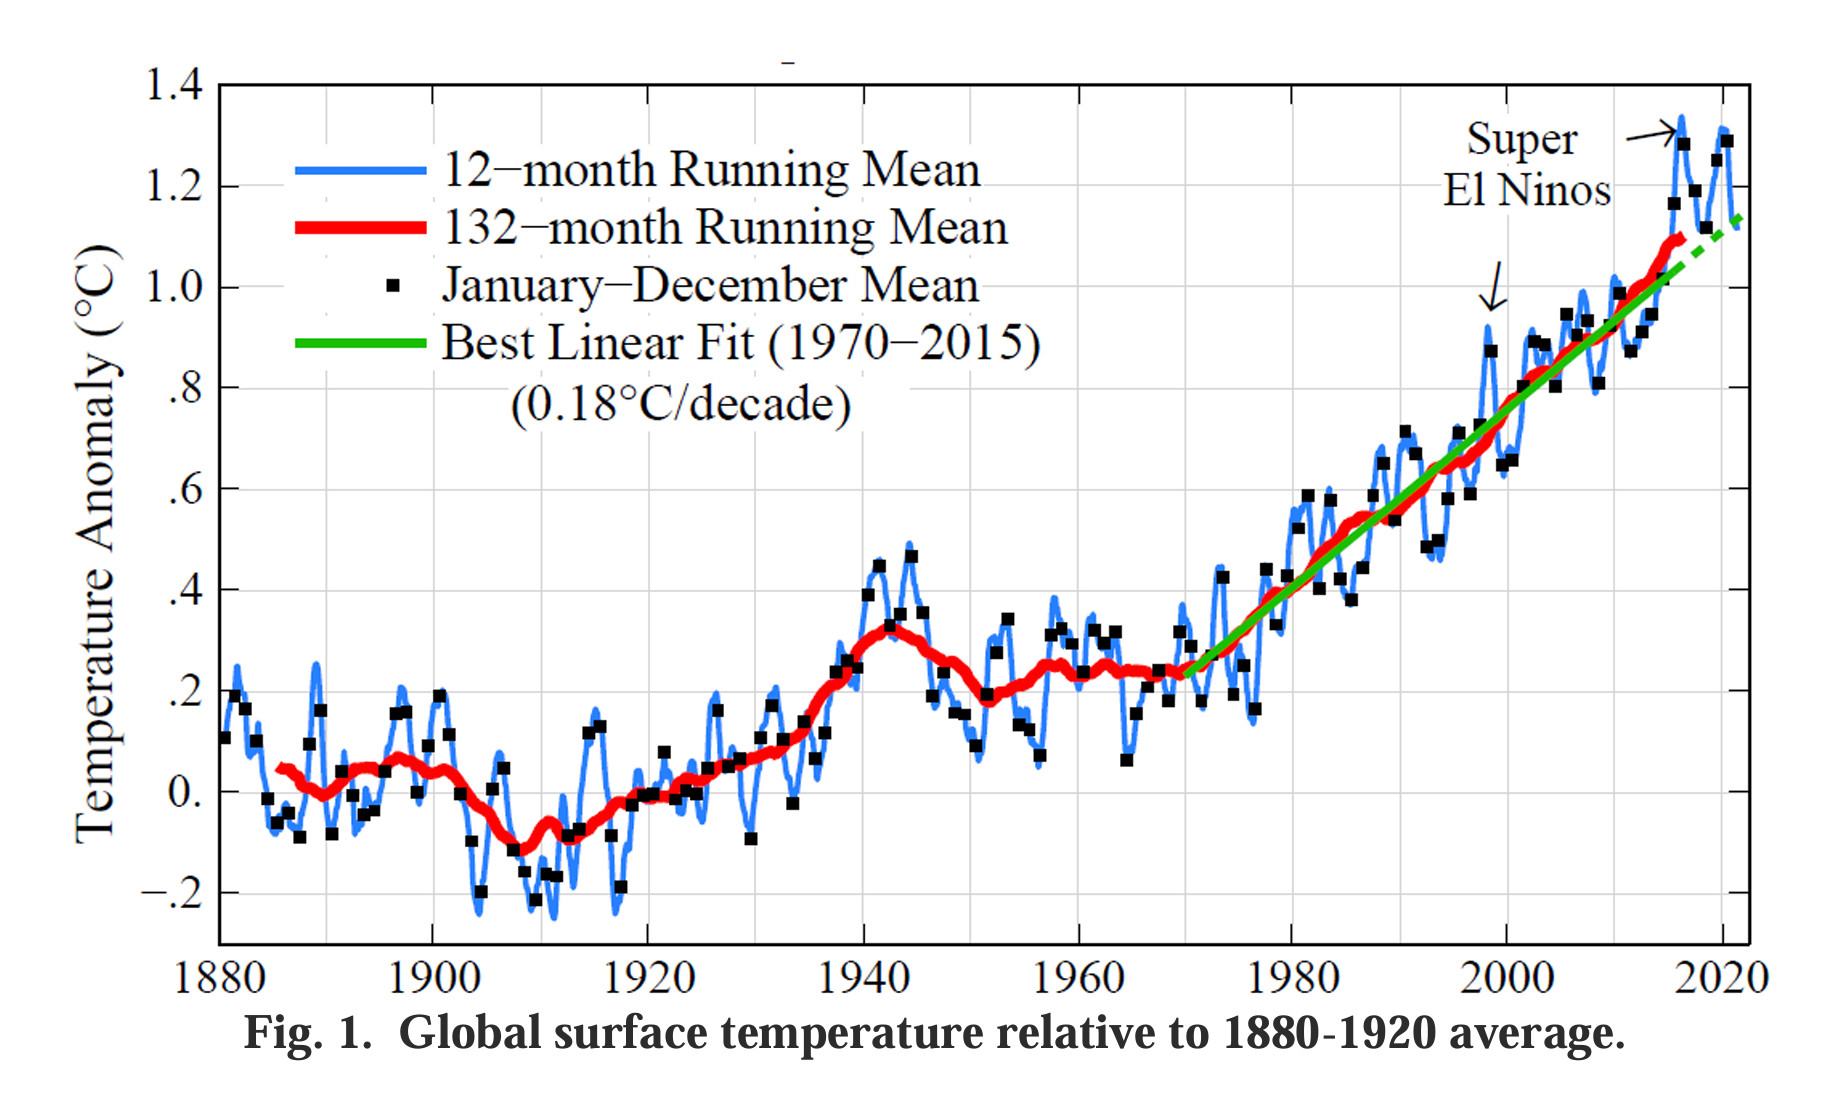
Surface Temperatures
Surface temperatures are one thing. But what about ocean temperatures? See the section on #heatstorage
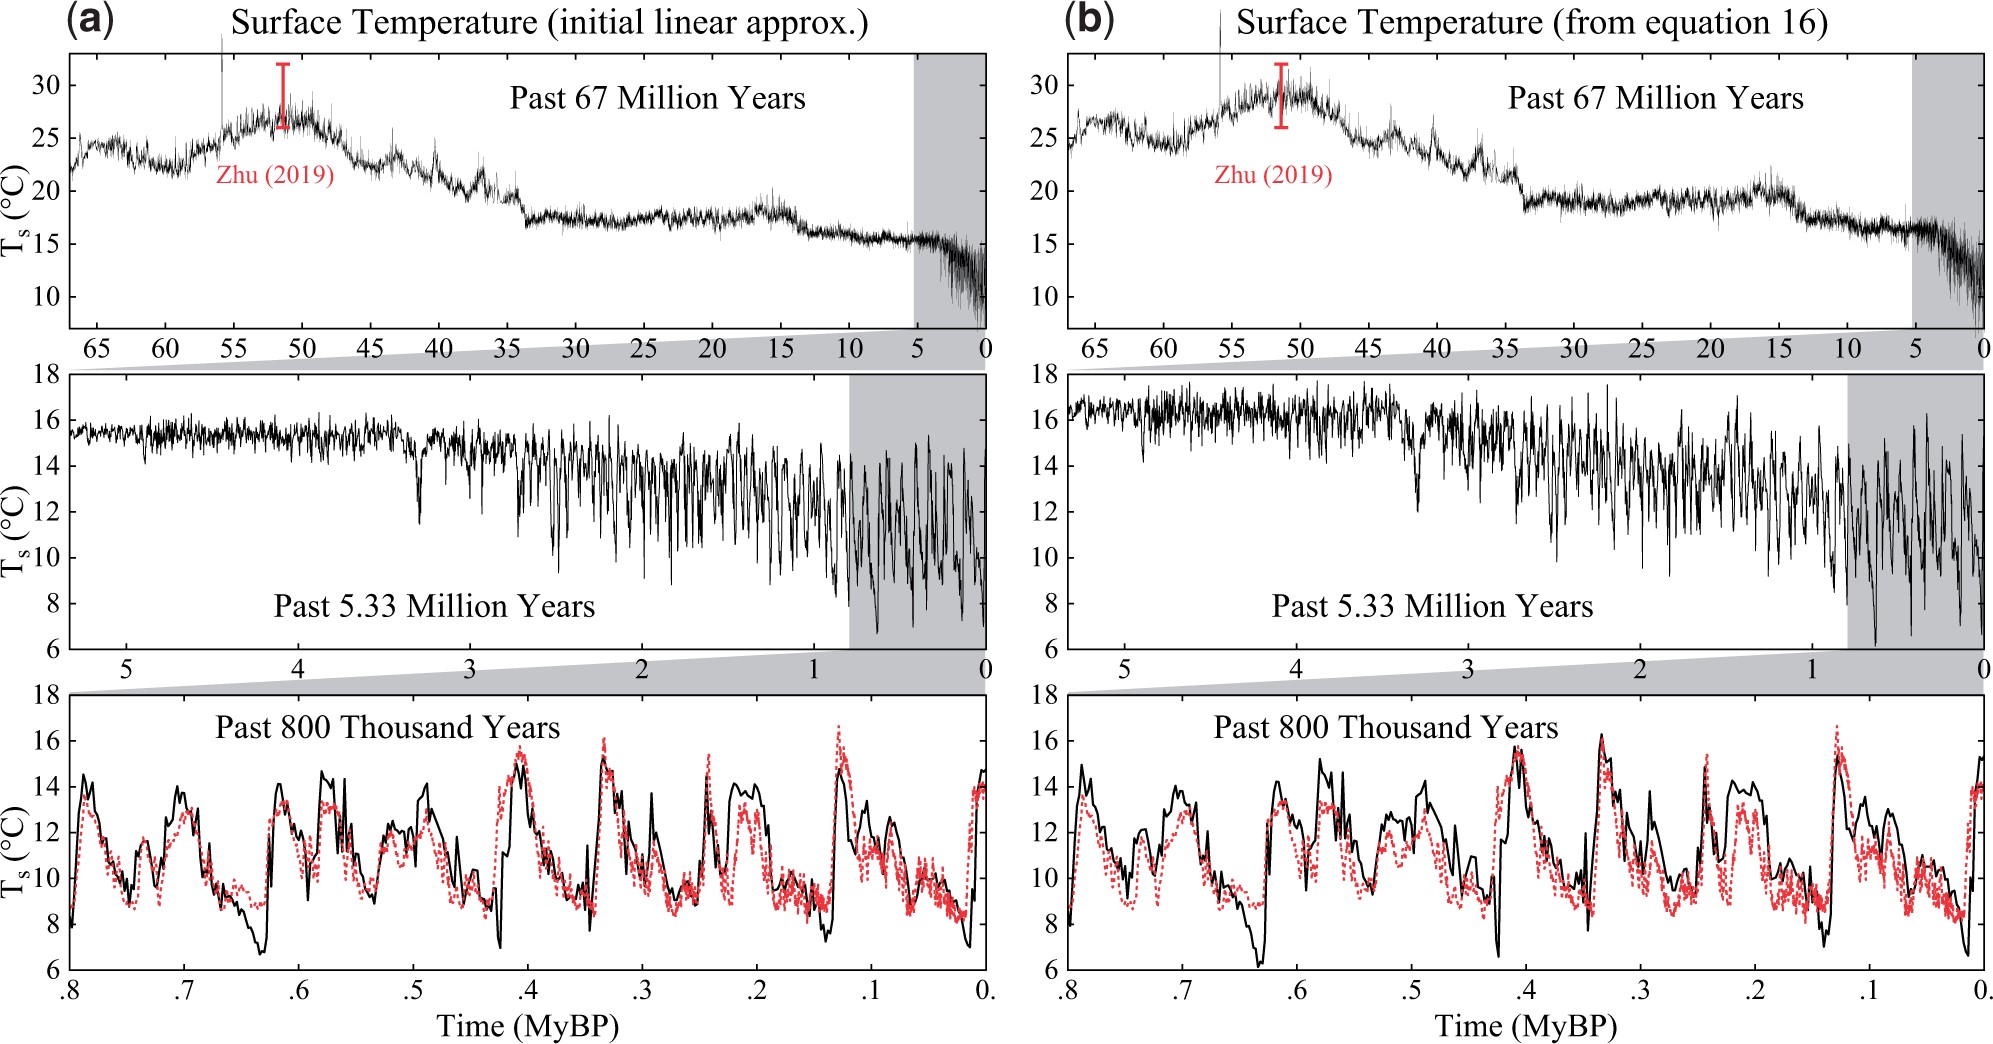
Temperature Matches CO2 Levels
1. Peak Aerosol – Scary Climate Change News
Hansen et al discuss in their 2023 paper “Global Warming in the Pipeline” that events can force both short-term and longer-term changes. Excessive warming can be traced to a reduction of human-made aerosols, as well as other factors. This is all around the net energy balance or EEI. Aerosols make a difference.
We conclude that peak aerosol climate forcing – in the first decade of this century – was of a (negative) magnitude of at least 1.5-2 W/m2. We estimate that the GHG plus aerosol climate forcing during the period 1970-2010 grew +0.3 W/m2 per decade (+0.45 from GHG, – 0.15 from aerosols), which produced observed warming of 0.18°C per decade. With current policies, we expect climate forcing for a few decades post-2010 to increase 0.5-0.6 W/m2 per decade and produce global warming at a rate at least +0.27°C per decade. In that case, global warming should reach 1.5°C by the end of the 2020s and 2°C by 2050 (Fig. 19).
James Hansen [6]
The world now has a real-life experiment to measure, as global shipping banned high sulphur bunker oil, and emissions stopped. The aerosols change reflectivity.
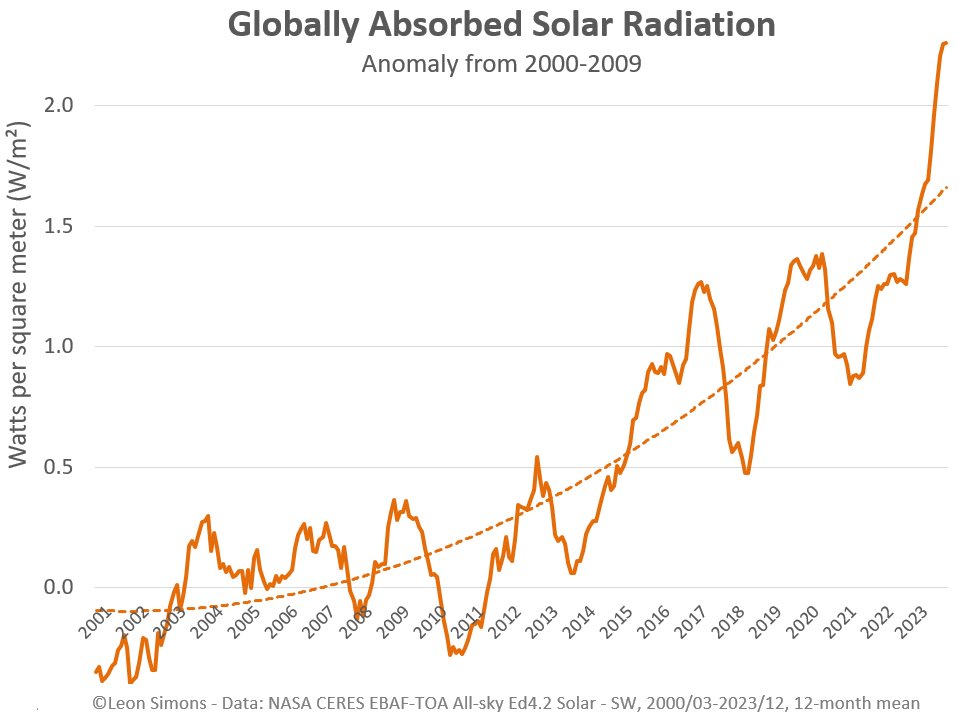
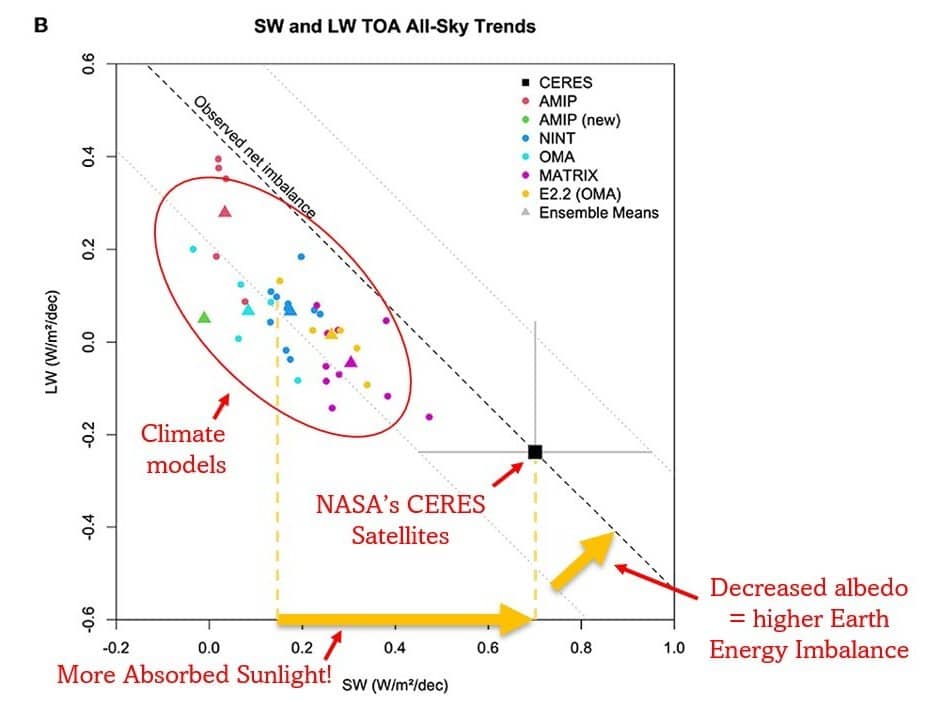
2. The Earth’s Reflectivity
The earth reflects the energy it receives from the sun. Reflectivity has been declining since 2003. The EEI impact is that more energy is absorbed by the land and sea. The land is 2x higher than average so land temperature will be 3o to 4o.
In terms of global warming effect, the drop in Earth’s reflectivity since 2020 (not a typo) is equivalent to instantly adding 100ppm CO2 to the atmosphere. Another way of saying it is that it’s equivalent to copying all the CO2 added to the atmosphere by humans since 1950 and then pasting it into today’s atmosphere
That’s enough CO2 to warm the planet from an ice age maximum to the Holocene.

Absorbed solar radiation anomaly is now an additional 2 W/m2 . This is mostly going into the oceans but is part of reason for 2023 being the hottest year on record. Note that the increase in the single year in 2023 was as much as the 2 decades previously (2000 to 2022, Leon Simons).
Most Climate Models Do Not Account for Aerosols
3. Increased CO2 Emissions
Fossil fuels powered the industrial revolution and raised living standards. They still provide most of the world’s energy (Fig. 27a) produce most CO2 emissions (Fig. 27b). Emissions may peak in 2023/2024 (IEA).
Much of the world is still in early or middle stages of economic development. Energy is needed and fossil fuels are a convenient, affordable source of energy. A litre of gasoline (petrol) provides the work equivalent of more than 100 h labor by a healthy adult. These benefits are the basic reason for continued high emissions. The Covid pandemic dented emissions in 2020, but 2022 global emissions were a record high level.
Fossil fuel emissions from mature economies are beginning to fall due to increasing energy efficiency, introduction of carbon-free energies, and export of manufacturing from mature economies to emerging economies. However, at least so far, those reductions have been more than offset by increasing emissions in developing nations (Fig. 28).
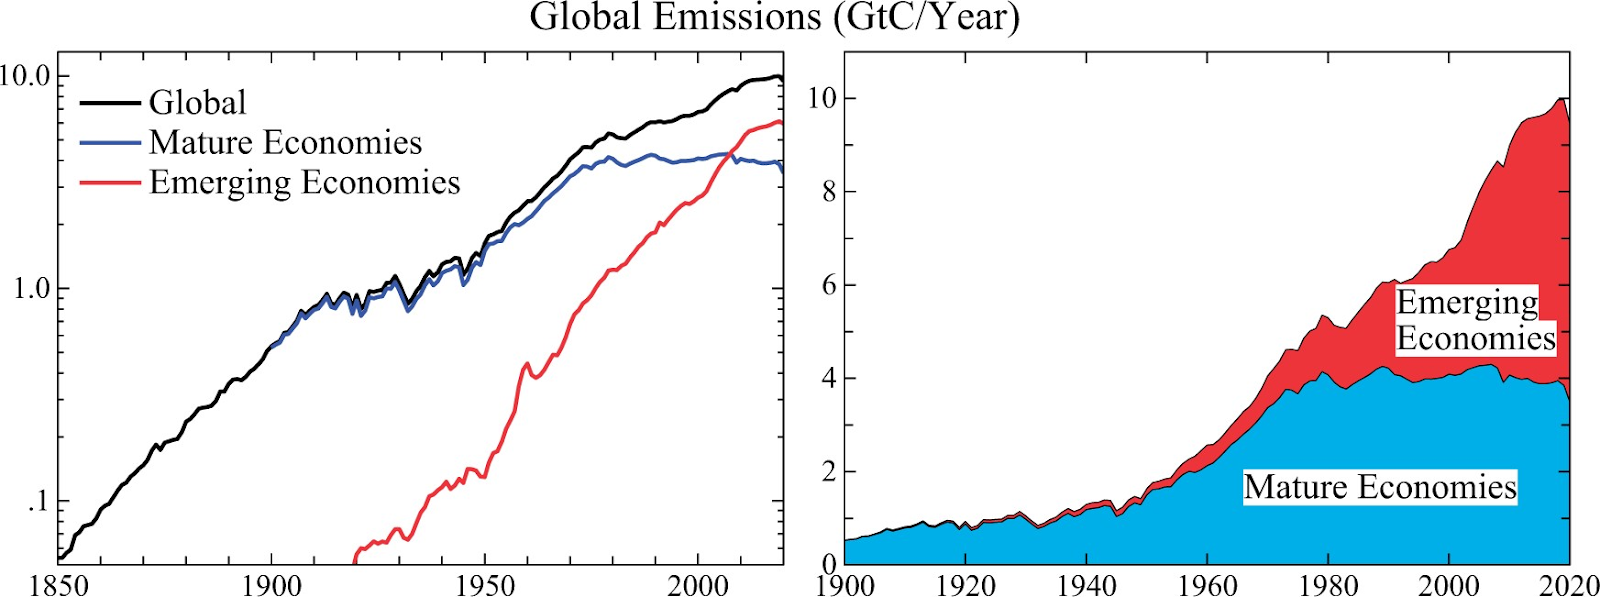
Fossil fuel CO2 emissions from mature and emerging economies. China is counted as an emerging economy. Data sources as in Fig. 27.
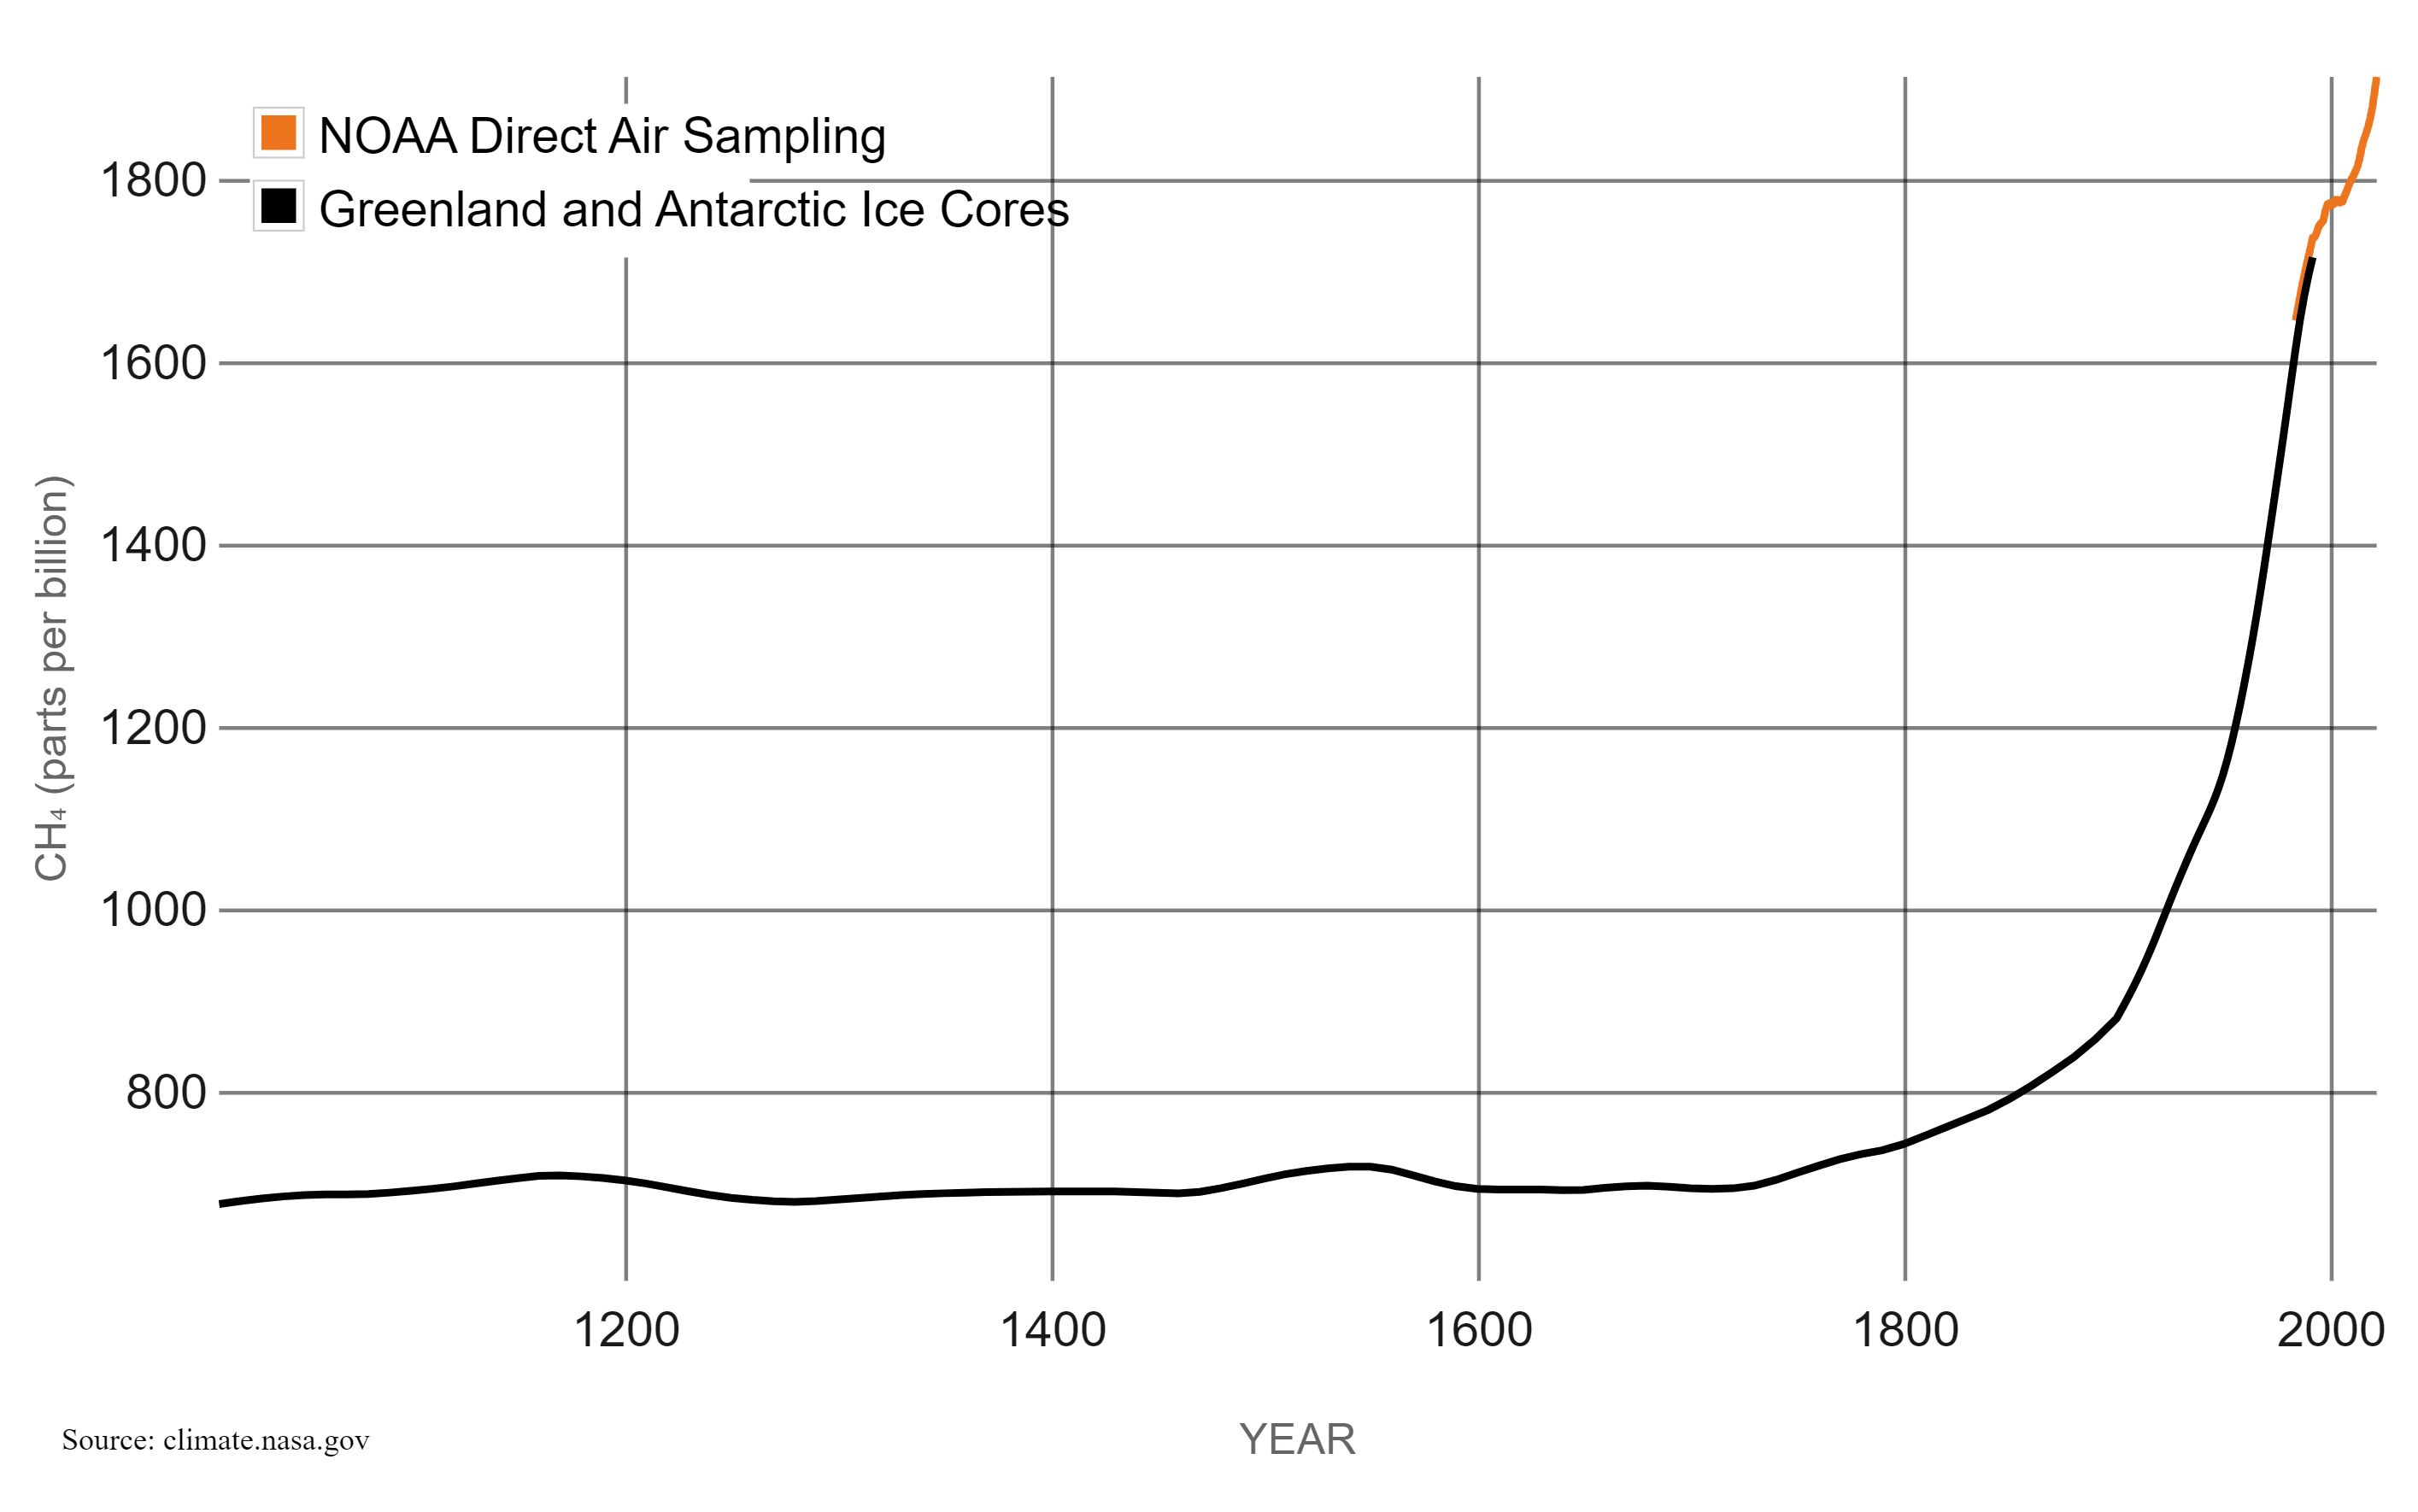
4. Methane Emissions Under Estimated
Methane is a key climate change gas, and its significance is now recognised as just as important as CO2. The world is heading to the temperatures of the The Eemian period (120,000 years ago) when the earth last warmed.
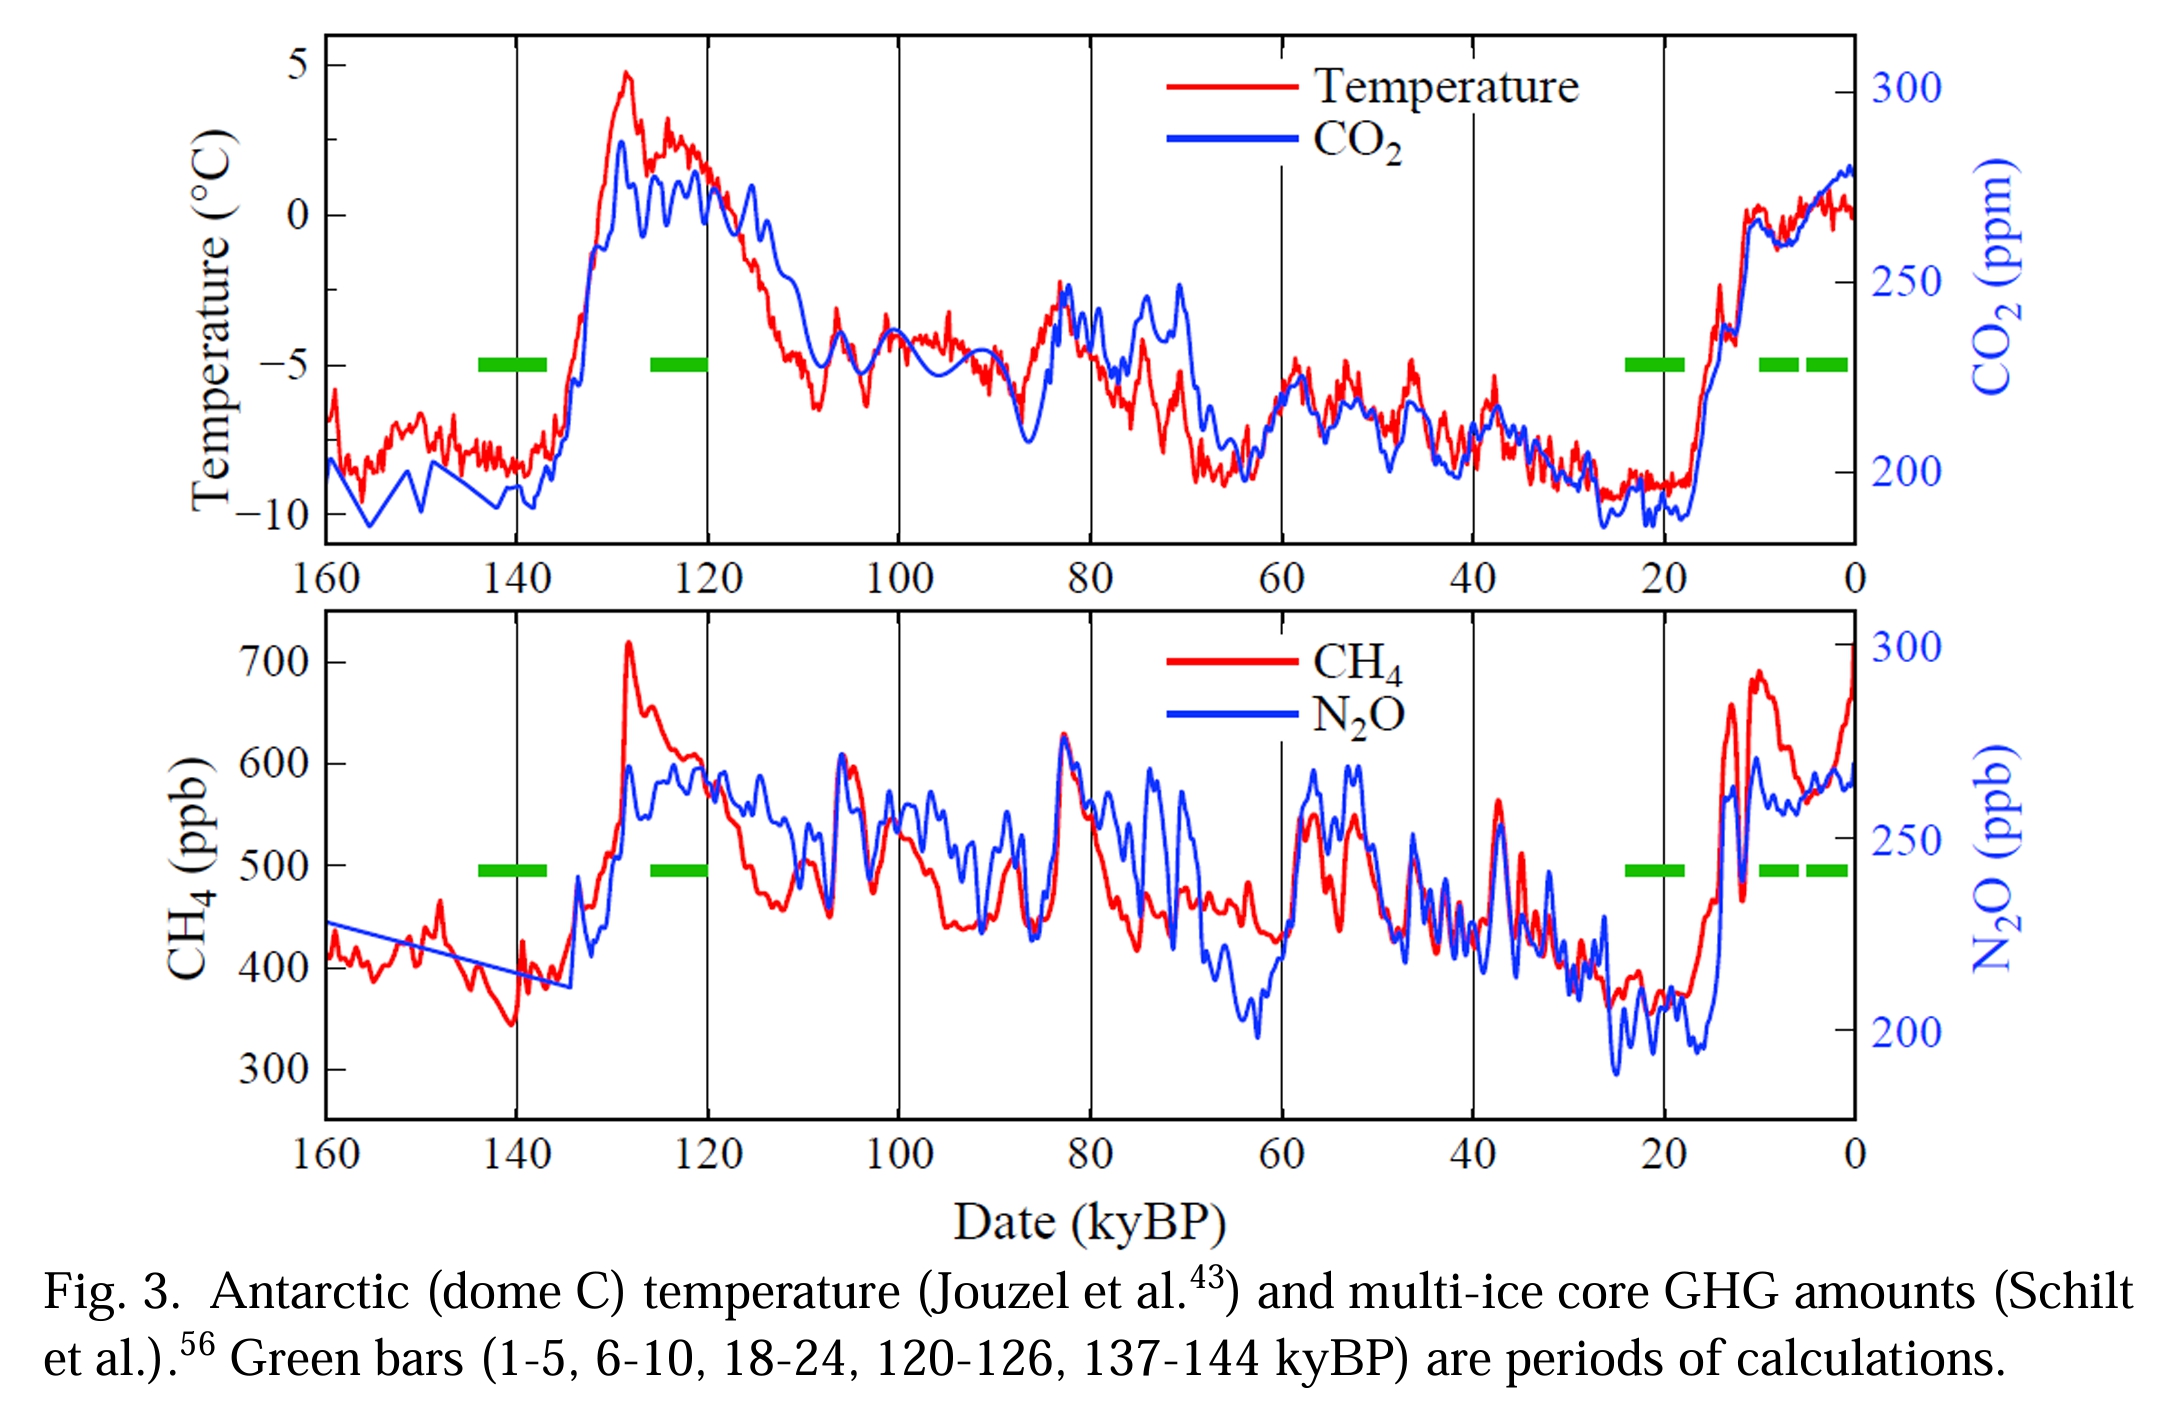
The concentration of methane in the atmosphere has more than doubled over the past 200 years. Scientists estimate that this increase is responsible for 20 to 30% of climate warming since the Industrial Revolution (which began in 1750). The levels of CO2, methane and nitrous oxides are now higher than the Eemian period.
Sherwin et al published in Nature March 2024 [6] showing USA shale oil and gas emissions are much worse than fossil fuel companies or US Geological have shown. The six-region weighted average is roughly three times the national government inventory estimate. The emissions are highly skewed with 1.66% of well sites contributing the majority (50–79%) of well site emissions.
Previously in Australia, methane monitoring demonstrated much higher emissions than companies reported by up to 80%. [8]
Areas of Russia have warming areas of permafrost that could release vast amounts of methane – far exceeding carbon emissions.
Starlink launched the first MethaneSAT – methane measuring satellites, funded by a nonprofit environmental group. MethaneSAT collects data about methane leaks from 300 targets worldwide while circling Earth 15 times a day from its orbit 580 km above ground.
5. Tipping Points
AMOC and other tipping points are referenced in this Change Discussion article, and the predicted tipping point is well before 2100 – the IPPC report consensus.
6. Where is the Heat Stored
From the energy balance, where is the heat stored? It is not on sea surface, nor the land but 90% is deep oceans. Depth 300 to 2000m

Energy Change
When a forcing perturbs Earth’s energy balance, the imbalance drives warming or cooling to restore balance. Observed EEI is now of order +1 W/m2 (more energy coming in than going out). Where does it go to? Deep ocean.

North Atlantic Sea Surface Temperature
An area of the North Atlantic is warming faster than normal.

More Reading
- How We Know that Global Warming is Accelerating and that the Goal of the Paris Agreement is Dead James Hansen 10 November 2023 https://www.columbia.edu/~jeh1/mailings/
- James E Hansen, Makiko Sato, Leon Simons, Larissa S Nazarenko, Isabelle Sangha, Pushker Kharecha, James C Zachos, Karina von Schuckmann, Norman G Loeb, Matthew B Osman, Qinjian Jin, George Tselioudis, Eunbi Jeong, Andrew Lacis, Reto Ruedy, Gary Russell, Junji Cao, Jing Li, Global warming in the pipeline, Oxford Open Climate Change, Volume 3, Issue 1, 2023, kgad008, https://doi.org/10.1093/oxfclm/kgad008
- https://www.columbia.edu/~jeh1/Documents/PipelinePaper.2022.12.22.pdf
- Bakker, P., Schmittner, A., M. Lenaerts, J. T., Abe-Ouchi, A., Bi, D., Chan, L., Hu, A., Beadling, R. L., Marsland, S. J., Mernild, S. H., Saenko, O. A., Swingedouw, D., Sullivan, A., & Yin, J. (2016). Fate of the Atlantic Meridional Overturning Circulation: Strong decline under continued warming and Greenland melting. Geophysical Research Letters, 43(23), 12,252-12,260. https://doi.org/10.1002/2016GL070457
- November Temperature Update and the Big Climate Short 23 December 2021 James Hansen, Makiko Sato, and Pushker Kharecha https://www.columbia.edu/~jeh1/mailings/2021/NovemberTUpdate+BigClimateShort.23December2021.pdf
- Sherwin, E.D., Rutherford, J.S., Zhang, Z. et al. US oil and gas system emissions from nearly one million aerial site measurements. Nature 627, 328–334 (2024). https://doi.org/10.1038/s41586-024-07117-5
- SpaceX rocket launches pioneering methane-tracking satellite to orbit 2024 https://www.space.com/methane-tracking-satellite-launch-spacex-transporter-10
- Not Measured, Not Managed: Australia remains ignorant of its coal mine methane problem 2023 https://ember-climate.org/insights/commentary/australia-coal-mine-methane-problem/
- Sixth Assessment Report IPPC 2021/2023 https://www.ipcc.ch/assessment-report/ar6/
- Last interglacial system https://en.wikipedia.org/wiki/Last_Interglacial
- von Schuckmann, K., Minière, A., Gues, F., Cuesta-Valero, F. J., Kirchengast, G., Adusumilli, S., Straneo, F., Ablain, M., Allan, R. P., Barker, P. M., Beltrami, H., Blazquez, A., Boyer, T., Cheng, L., Church, J., Desbruyeres, D., Dolman, H., Domingues, C. M., García-García, A., Giglio, D., Gilson, J. E., Gorfer, M., Haimberger, L., Hakuba, M. Z., Hendricks, S., Hosoda, S., Johnson, G. C., Killick, R., King, B., Kolodziejczyk, N., Korosov, A., Krinner, G., Kuusela, M., Landerer, F. W., Langer, M., Lavergne, T., Lawrence, I., Li, Y., Lyman, J., Marti, F., Marzeion, B., Mayer, M., MacDougall, A. H., McDougall, T., Monselesan, D. P., Nitzbon, J., Otosaka, I., Peng, J., Purkey, S., Roemmich, D., Sato, K., Sato, K., Savita, A., Schweiger, A., Shepherd, A., Seneviratne, S. I., Simons, L., Slater, D. A., Slater, T., Steiner, A. K., Suga, T., Szekely, T., Thiery, W., Timmermans, M.-L., Vanderkelen, I., Wjiffels, S. E., Wu, T., and Zemp, M.: Heat stored in the Earth system 1960–2020: where does the energy go?, Earth Syst. Sci. Data, 15, 1675–1709, https://doi.org/10.5194/essd-15-1675-2023, 2023.
- Schuckmann, Karina & Cheng, Lijing & Palmer, Matthew & Hansen, James & Tassone, Caterina & Aich, Valentin & Adusumilli, Susheel & Beltrami, Hugo & Boyer, Tim & Cuesta-Valero, Francisco José & Desbruyères, Damien & Domingues, Catia & García-García, Almudena & Gentine, Pierre & Gilson, John & Gorfer, Maximilian & Haimberger, L. & Ishii, Masayoshi & Johnson, Gregory & Wijffels, Susan. (2020). Heat Stored in the Earth System: Where Does the Energy Go? Earth System Science Data. 12. 2013-2041. 10.5194/essd-12-2013-2020. https://www.researchgate.net/publication/345434345_Heat_Stored_in_the_Earth_System_Where_Does_the_Energy_Go
- Bakker, P., Schmittner, A., M. Lenaerts, J. T., Abe-Ouchi, A., Bi, D., Chan, L., Hu, A., Beadling, R. L., Marsland, S. J., Mernild, S. H., Saenko, O. A., Swingedouw, D., Sullivan, A., & Yin, J. (2016). Fate of the Atlantic Meridional Overturning Circulation: Strong decline under continued warming and Greenland melting. Geophysical Research Letters, 43(23), 12,252-12,260. https://doi.org/10.1002/2016GL070457