The challenge to have 100% renewable energy in 145 countries in 6 years is detailed by Mark Jacobson and others from Stanford called “Low-cost solutions to global warming, air pollution, and energy insecurity for 145 countries” and published in energy and Renewable Science. Their conclusions:
- 145 countries, 100% Renewable
- Net job increase = 28 million
- Reduction end user energy cost = 56.4%
- Reduces energy costs = 62.7% ($17.8 to $6.6 trillion pa)
- Reduces social energy costs 92.0% ($83.2 to $6.6 trillion pa)
- Present-value cost of $61.5 trillion
- Mean payback times of capital = 5.5 years
- Mean payback time for Social Energy = 0.8 years
The various components include heat pumps. Battery electric vehicles, and elimination of mining, moving and processing fossil fuels. There would be losses in fossil fuel countries such as Canada, Russia and oil rich states.
80% Transition by 2030 and 100% by 2030 for Net Zero

Jacobson in Mar 2024 reported on Twitter (X) that California did the unthinkable just a few years ago and provided >100% of the amount of its main grid electricity demand from WindWaterSolar alone for several hours FOUR DAYS IN A ROW. (https://www.caiso.com/TodaysOutlook/Pages/supply.html).
Transition Pathway

How Much Space Needed
Jacobson has an image of land needed

Figure. Footprint plus spacing areas (km2) required beyond existing 2018 installations, to power all energy sectors (electricity, transportation, heating/cooling, industry, agriculture/forestry/fishing, the military) in 143 countries in 2050 with 100 percent WWS. For hydropower, the new footprint plus spacing area is zero since no new installations are proposed. For rooftop PV, the circle represents the additional area of 2050 rooftops that needs to be covered (thus does not represent new land).
Rethinkx Model
Tony Seba from RethinkX in his model in 2021 says that the clean energy curve would require 3 to 4 x generating capacity.

Rewiring Australia
Dr Saul Griffith says in his book that the energy cost per household reduces by 60%.
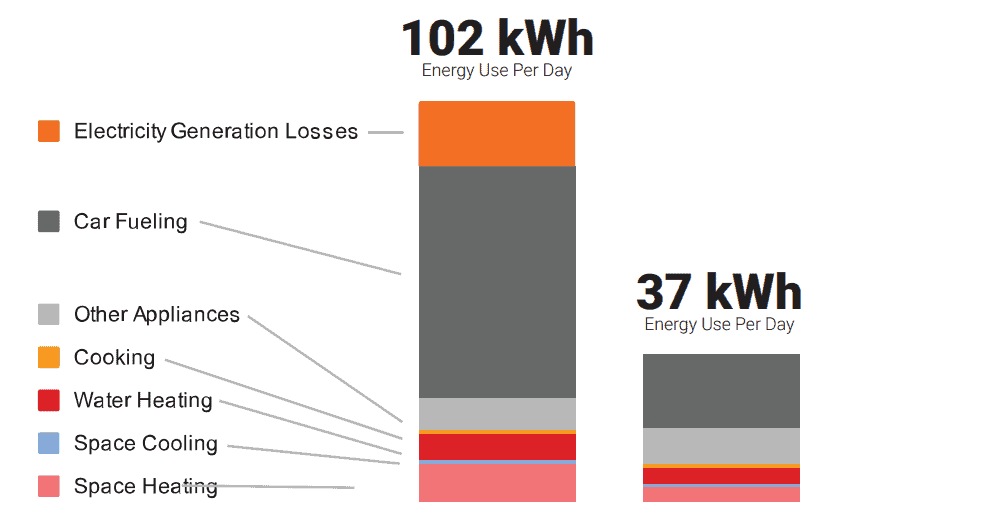
Implications of 100% Renewable Energy
The roadmaps call for a 100% transition of all-purpose business-as-usual (BAU) energy to wind-water-solar (WWS) energy, efficiency, and storage, ideally by 2035, but by no later than 2050, with at least 80% by 2030. Grid stability analyses find that the countries, grouped into 24 regions, can exactly match demand with 100% WWS supply and storage, from 2050–2052.
Worldwide, WWS reduces end-use energy by 56.4%, private annual energy costs by 62.7% (from $17.8 to $6.6 trillion per year), and social (private plus health plus climate) annual energy costs by 92.0% (from $83.2 to $6.6 trillion per year) at a present-value cost of ∼$61.5 trillion. The mean payback times of the capital cost due to energy- and social-cost savings are 5.5 and 0.8 years, respectively. WWS is estimated to create 28.4 million more long-term, full-time jobs than lost worldwide and may need only ∼0.17% and ∼0.36% of world land for new footprint and spacing, respectively.
Dr David Osmond 100% RE in Australia
Dr David Osmond has a model where he tracks actual demand. His assumptions are on Twitter at
Thread: Each week I run a simulation of Australia’s main electricity grid using rescaled generation data to show that it can get very close to 100% renewable electricity with just 5 hrs of storage (24 GW / 120 GWh)
— David Osmond (@DavidOsmond8) March 22, 2023
Results:
last week: 100% RE
last 82 weeks: 99.2% RE (1/4) pic.twitter.com/02wx7XYNrZ
Renewable Energy – Superpower
- Tony Seba Video https://www.youtube.com/watch?v=PM2RxWtF4Ds
- Renew Economy Article https://reneweconomy.com.au/export-superpower-aemo-to-model-even-faster-paths-to-net-zero-emissions-93231/
- Wind Water Solar Jacobson Stanford University https://web.stanford.edu/group/efmh/jacobson/WWSBook/WWSBook.html
- Jacobson, M.Z., A.-K. von Krauland, S.J. Coughlin, E. Dukas, A.J.H. Nelson, F.C. Palmer, and K.R. Rasmussen, Low-cost solutions to global warming, air pollution, and energy insecurity for 145 countries, Energy & Environmental Sciences, , doi:10.1039/d2ee00722c, 2022 (pdf)