With a market capitalization about $1 trillion dollars (in Nov 2021 but $0.8T in Feb 2022, or $0.56T in mid 2024), is Tesla market cap too high? The combined market cap of the next 10 auto manufacturers including Toyota, Volkwagen, General Motors Ford and Stellantis is only as much as that of Tesla. Data for each company is in the table below. For more details about global car production, check out global car sales and EV Pickup Trucks are coming. Data is taken from annual reports and Yahoo.com, and other data sources.
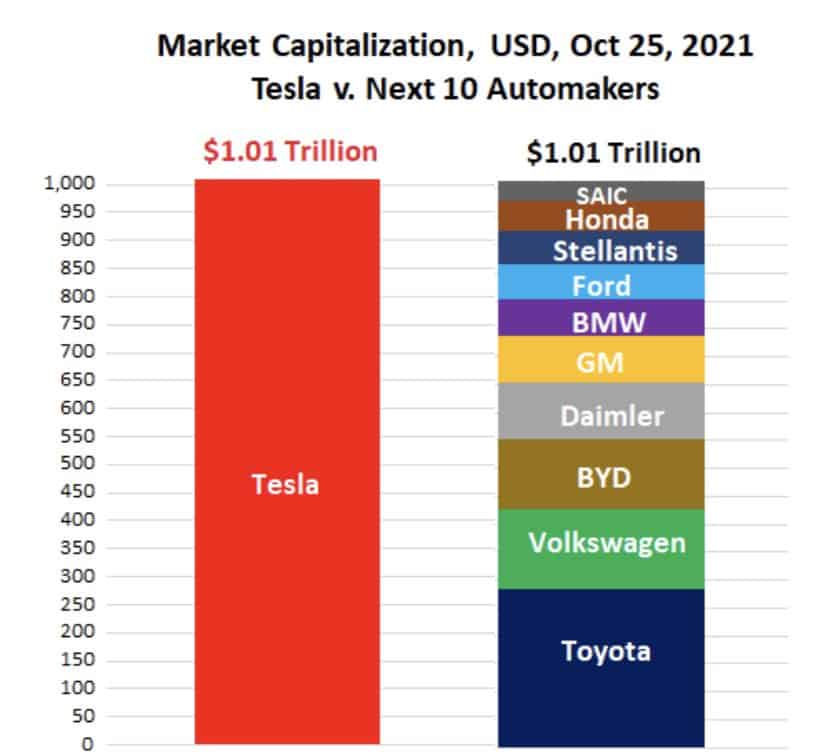
Is Telsla Market Cap Too High?
Here are just some of the reasons why some consider it too high and others suggest it will exceed $2T within 2 years.
Increasing Vehicle Sales
Tesla produced about 1m vehicles in 2021. Most forecast to grow 50% Year on Year for the next 5 years without major capital investment. Factories include doubling of the Shanghai, China factory to 2m pa., ramp up of new Gigafactory Texas of 2m, Gigafatory Berlin (1m) and existing Fremont (1m) which would take it 6 million cars by 2025. At the Q4/2021 call, the company said they were currently constrained by chip shortage and could meet 1.4m in 2022. Without production at Austin or Berlin.
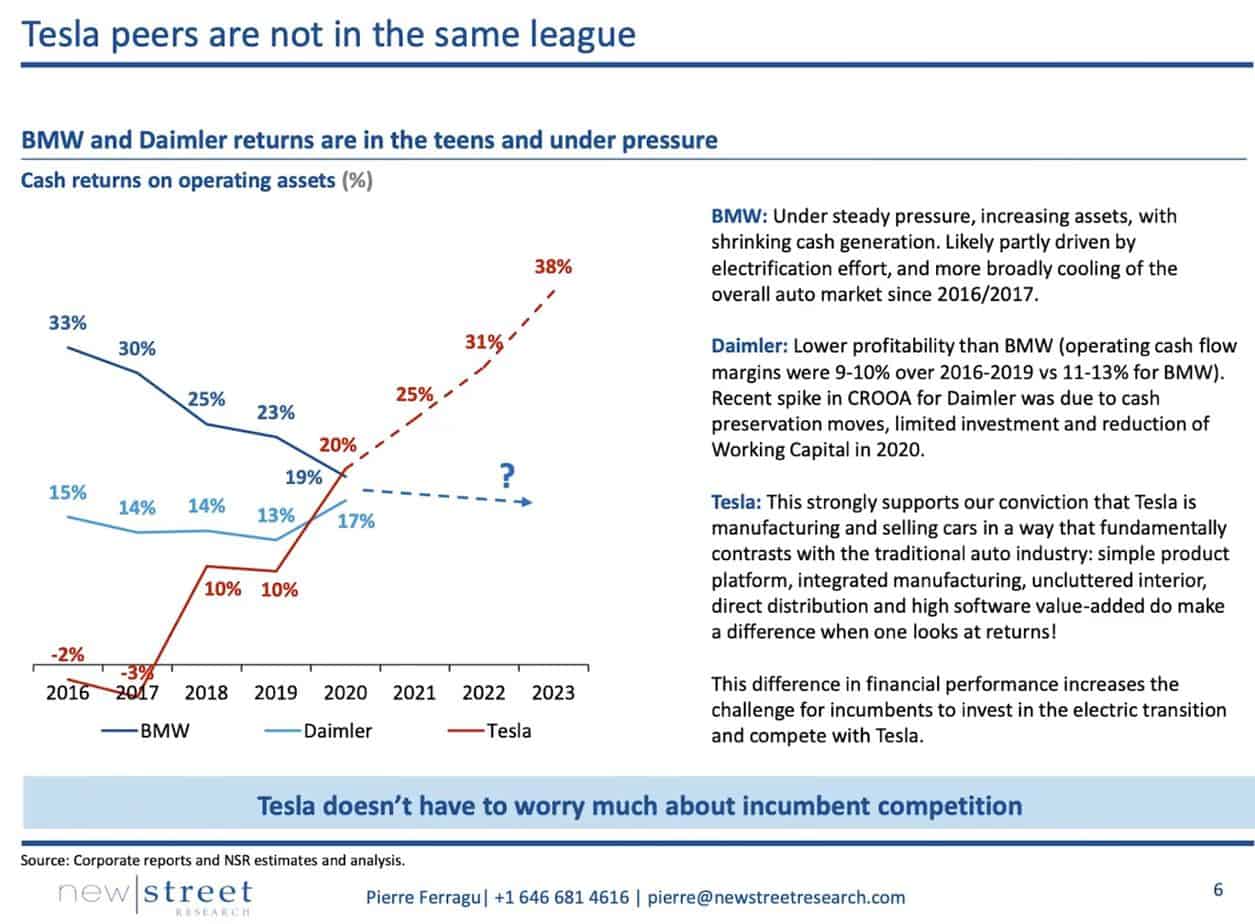
Highest profitability of all manufacturers
Gross Margin from vehicle production is highest in the industry. Telsa has less than $20b in capital over past 3 years, and others have over $100b. See image below on margins from James Stephenson @ICannot_Enough
Increasing Efficiency
Tesla has no legacy dealers, factories or vehicles and is using the most advanced technology to eliminate labour. Adoption of “gigapress” that produces both front and rear casting supposedly reduced the number of robots by 50%.
Valuable Insurance Business
With its own insurance business that is based on individual driving performance, Tesla has a new business that can reduce risks and increase gross margin for no marketing costs.
Energy Business
The battery business, for households and Big Grid, has been constrained by battery availability. It is forecast to expand from 1GW to 1TW within 5 years
Robotaxi Value
Full Self Driving (FSD) is in Beta phase. Some analysts suggest some of the $12,000 revenue margin to further increase returns and only 15% of existing customers currently buy it due to availability.
Leading technology of Electric Vehicles
Leading technology of electric drive including manufacturing technologies such as manufacture, software management provides a low cost model others are trying to do but with their extended supply and OEM chain will require billions of investment.
Battery Technology
With 15 years of technology, their latest 4680 battery technology may decrease battery costs 50%. Tesla has supply chain control unlike some other manufacturers..
Tesla Growth is exponential
Forecast Vehicle Sales increasing to 3m per year


Cash Returns from Operating Assets Highest in Industry
GAAP Operating Margins

Compare Tesla – Ford – GM Q1, 2022
Despite Ford or GM delivering 3 times the number of vehicles, their margin per car is about 20% that of Tesla.
| Q1 22 $millions | Tesla | Ford | GM |
|---|---|---|---|
| Reported GAAP Net Income | 3,318 | (3,110) | 1,987 |
| Plus mark-to-market Rivian Loss | – | 5,4000 | – |
| GAAP Net Income (Ex Rivian) | 3,319 | 2,290 | 1,987 |
| Deliveries (number) | 310,048 | 966,000 | 831,000 |
| Net Income per Delivery | $10,048 | $2,371 | $2,391 |
Global Car Manufacturers
A comprehensive list is shown below. Tesla is 17th of the number of the manufacturers but 8th most profit. It is 50% more profitable than GM, even though it currently sells just 1/6th of the vehicles.
| Group | Sales | Rev $B | EBITDA $B | 3Cap (B) | Debt $B | Invest (3yr) | PE | Op Margin % |
|---|---|---|---|---|---|---|---|---|
| Toyota | 9,529,000 | 249.4 | 6.1 | 258 | 182 | 99.3 | 9.4 | 8.08 |
| Volkswagen | 9,306,000 | 254.1 | 51.0 | 130 | 227 | 497 | 7.0 | 6.38 |
| Stellantis | 6,915,000 | 98.8 | 16.4 | 61 | 76 | 35 | 7.8 | -1.92 |
| GM | 6,828,000 | 122.5 | 27.0 | 88 | 110 | 77 | 8.1 | 7.43 |
| Hyundai-Kia | 6,406,000 | 88.1 | 12.3 | 28 | 91 | 209 | 4.4 | 5.68 |
| SAIC Motor | 5,601,000 | 106 | 0.05 | 37 | 163 | 91 | 22.5 | |
| Honda | 4,399,000 | 121.8 | 1.8 | 49 | 112 | 198 | 6.0 | 5.01 |
| Ford | 4,187,000 | 127 | 16.0 | 87 | 145 | 21.7 | 12.4 | 7.17 |
| Daimler AG | 2,841,000 | 175.9 | 16.7 | 83 | 169 | 20.0 | 6.3 | 11.19 |
| Suzuki | 2,448,000 | 4.0 | 19 | 6.6 | 35 | 11.8 | ||
| BMW Group | 2,325,000 | 112.8 | 22.0 | 67 | 113 | 4.6 | 10.0 | |
| Geely | 1,321,000 | 14 | 6.9 | 27 | 6 | 33.7 | ||
| Mazda | 1,244,000 | 31 | 2.1 | 6 | 15 | 11.3 | ||
| Great Wall | 1,116,000 | 62 | 8.9 | 56 | 27.4 | |||
| Subaru | 885,000 | 34 | 14 | 0 | 11.6 | |||
| Tata | 835,000 | 102 | 0.2 | 25 | 10 | -34.0 | ||
| Tesla | 980,000 | 54 | 9.6 5 (Q1/22) | 1,200 | 0.1 | 11 | 88.0 | 19.2 |
| Ferrari | 9,200 | 4.86 | 0.01 | 4 | 48.0 | 24.4 | ||
| Aston Martin | 3,400 | 0.6 | 2 | -4.6 | ||||
| McLaren | 2,900 | 0.78 | 1 | |||||
| BYD | 426,000 | 24 | 123 | 49 | 35.0 | |||
| Rivian | 920(2021) 10,000(2022) | 0 | 0.0 | 90 | 0.18 | 4.6 | ||
| Lucid | 300(2021) 12,000(2022) | 0 | 68 | 0.216 | N/A |
There are a large number of other car manufacturers. E.g. There are over 240 EV companies in China alone making EV cars. Some of the new entrants (Rivian, Lucid) have high market cap but don’t yet have any major sales. Others have production and low market cap.
Some of debt is vehicle lease and inventory.