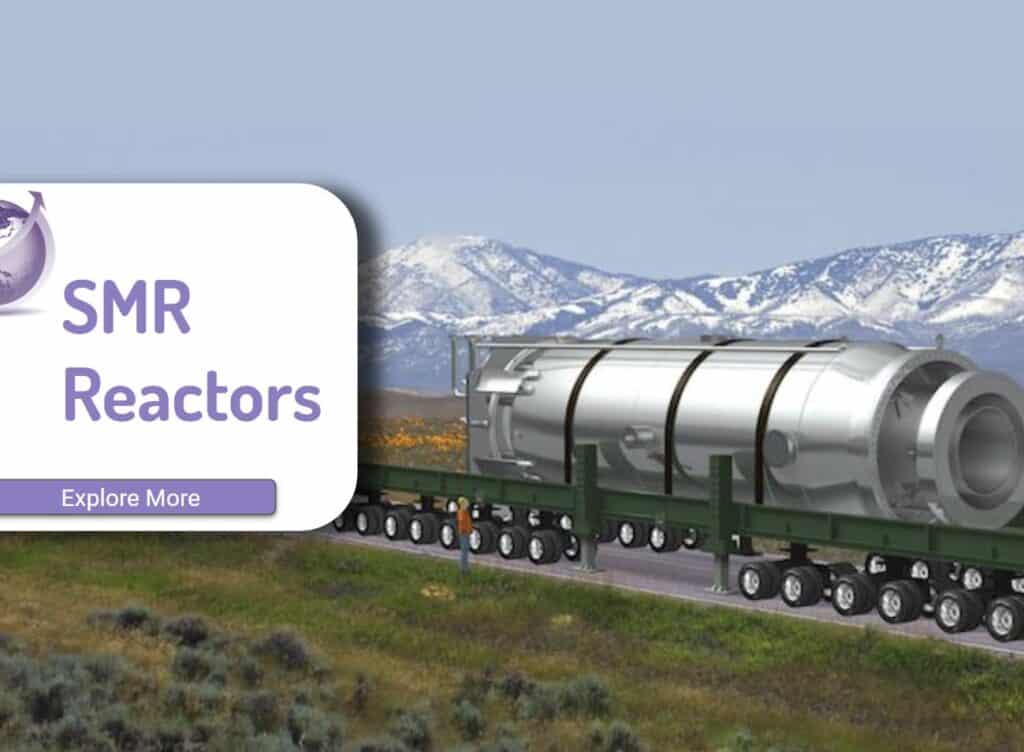
A Life Cycle analysis of nuclear in the French nuclear fleet shows nuclear emitted more CO2 than wind and in some countries such as USA the emissions would be as high as gas. Life cycle analysis looks at all the steps from mining to refining to enrichment and to waste disposal. Multiple myths exist about nuclear; subsidies are large; waste is unresolved, and Small Nuclear Reactors have their own issues. Nuclear energy contributes ~10% of the global electricity generation and different views exist on its carbon-intensity and sustainability.
The authors came up a number of 5.29 gCO2eq/Whe. USA figures 55 gCO2eq/KWhe. Note that more recent figures are much higher than these.
Life Cycle Analysis of Various Energy Sources
| Fuel Source | gCO2e/kWhe | Notes & Explanation |
|---|---|---|
| Wind | 5-8 | Most emissions from construction steel and concrete |
| Nuclear | 6-110 Uo to 200 | Mining and enrichment markedly change emissions. As rich ore bodies are mined out, more energy is needed for less rice ore bodies. 80 years of supply left. |
| Solar | 38 | Using Maxeone 40 year panels and Fronius inverter 8kW |
| Gas | 500 | Fossil methane |
| Oil | 800 | Bunker oil and oil fired boilers induce a range of other pollutants |
| Coal | 1000 | Calculation of emissions from mining may underestimate total emissions by 2 or more times |
The main contributions come from the reactor’s operation (40%), the mining activities (32%) and enrichment (12%). On the other hand, conversion, disposal and reprocessing operations account respectively for 5, 2 and 7%.

But if the mining is poor, the authors conclude the number could be as high as 200. Today, mines are going full on with renewable energy for transportation and no doubt they could reduce carbon emissions substantially.
Life Cycle Analysis of Nuclear Too Low?
A recent LCA in 2021 (Hart et al) concluded from the life cycle assessment of a new nuclear power plant in Europe that the results were higher than generally accepted.
- Three methods were used: process-based, input-output, and hybrid life cycle assessment.
- Results range from 8 to 64 gCO2e/kWhe.
- Averages for the three methods are 16.97, 24.89 and 27.63 gCO2e/kWhe.
These are either well above or at the upper end of the range of possibilities (5 to 22 gCO2e/kWh) stated in a report for the UK’s Committee on Climate Change, and significantly higher than the median value of 12 gCO2e/kWh presented by the Intergovernmental Panel on Climate Change. They are also higher than the values acknowledged by the nuclear industry.
Pomponi and Hart https://doi.org/10.1016/j.apenergy.2021.116743
Wind Life Cycle Analysis
A Life cycle analysis done in 2012 says wind was 5.0–8.2 g CO2/kWh. The authors state these could be halved with production of the steel, the concrete and disposal of blades sorted.
Wind energy plays an increasingly important role in the world’s electricity market. Wind energy mitigate the effects of climate change by reducing CO2 intensity of the energy sector. This study developed a new direct and simple method for estimating CO2 emissions per kWh produced during the life cycle of four representative wind power plants (three in developed countries and one in China). The life cycle analysis focuses on the wind power plant as the basic functional object instead of a single wind turbine. Compared with offshore wind plants, onshore plants have lower CO2 emissions per kWh electricity and require less transmission infrastructure.

- Carbon dioxide emissions vary from 6.4 to 12.3 g/kWh
- Methane emissions range from 2.8 to 16.9 mg/kWh.
- Nitrogen oxides emissions range from 18 to 56.4 mg/kWh.
- NMVOCs are emitted in quantities that range from 1.7 to 11.4 mg/kWh
- Particulates range from 10.5 to 54.4 mg/kWh
- Sulphur dioxide emissions range from 22.1 to 44.7 mg/kWh.
References
- Yuxuan Wang, Tianye Sun, 2012 Life cycle assessment of CO2 emissions from wind power plants: Methodology and case studies, Renewable Energy, Volume 43,
Pages 30-36 https://doi.org/10.1016/j.renene.2011.12.017 - Ch. Poinssot, S. Bourg, N. Ouvrier, N. Combernoux, C. Rostaing, M. Vargas-Gonzalez, J. Bruno, 2014 Assessment of the environmental footprint of nuclear energy systems. Comparison between closed and open fuel cycles, Energy, Vol 69, P199-211, ISSN 0360-5442, https://doi.org/10.1016/j.energy.2014.02.069.
- Francesco Pomponi, Jim Hart 2021 The greenhouse gas emissions of nuclear energy – Life cycle assessment of a European pressurised reactor. Applied Energy, Vol 90, 116743, ISSN 0306-2619, https://doi.org/10.1016/j.apenergy.2021.116743.


