Climate change and associated frequent droughts has caused hydropower reductions. We need to dispell the myth we should build more hydropower. The best places to build dams have already been used. Over the past two decades, the installed global capacity of hydropower has grown from 680 GW in 2000 to nearly 1,200 GW in 2021, a growth rate of more than 75%. Most of this has been in China and Brazil.
While Greeks used hydropower to grind wheat, it was not until the 1900’s that dams became popular. Today, hydro provides about 71% of all renewable electricity. Wind and solar are 90% of all new generation
Hydropower by Country


Much of this hydropower is in China. Older dams were in better locations, and new have inferior geophysics and face many more environmental concerns. Some dams produce substantial methane from buried plant matter.
Wikipodeia has more information[1]
The focus on hydropower:
- Pumped hydro. Rain or river flows replenish water.
- Improving the efficiency of generation.

Hydropower reductions From IEA Data
The data in the 2023 IEA Update demonstrates that climate change is possibly making hydro an at risk resource in renewable energy. The capacity factor of global hydropower has been on a declining trend over the last decade, falling from an average of 38% in 1990-2016 to about 36% in the recent years 2020-2022. This two-percentage-point difference means that, globally, today’s hydropower installed base is producing about 240 TWh less electricity annually than what it would have produced had capacity factors stayed where they were a decade ago
Canada saw capacity factors drop 4% due to persistent droughts throughout the Western states. Brazil has seen a dramatic drop and hydro capacity factors dropped from 56% in 1990-2012 to an average of 44% in 2013-2022. Severe droughts in 2014-2017 and 2019-2021, especially in states like Sao Paulo, Rio de Janeiro, and Minas Gerais, caused water shortages, crop production declines, and power cuts.
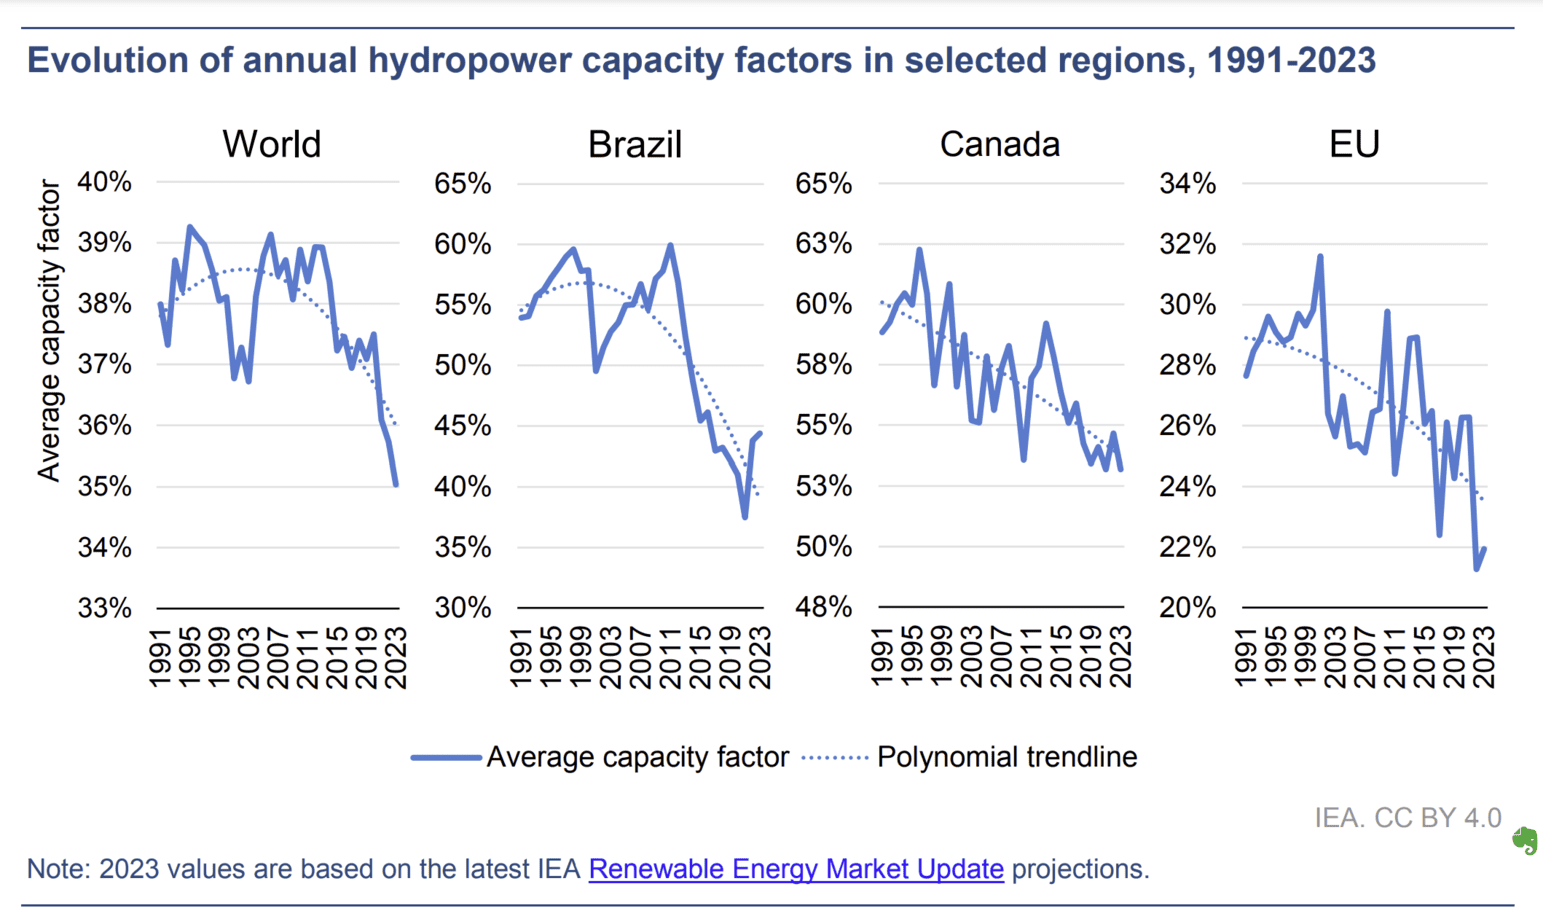
Hydropower capacity factors, declined from an average of 28% between 1990 and 2014 to 25% from 2015 to 2022. Severe droughts hit Southern Europe in 2017, and Central and Eastern Europe in 2018. The 2022 drought, the worst in Europe in 500 years, reduced agricultural production, reduced hydropower generation, and limited nuclear power cooling. EU hydropower generation was 19% lower in 2022 than 2021 – a historic decline in the last 30 years.
Hydropower in China
30% of world’s hydropower generation takes place in China. This massive scale means that any changes in Chinese hydro regimes have a large impact on global statistics.
The capacity factor in China rose from an average of 37% over 1990-2008 to an average of 39% in 2009-2022. Building of large, more efficient hydropower plants such as the Three Gorges Dam drove this increase. There was a significant fall in 2021 and 2022 due to major droughts, which are continuing through 2023.
Sources and References
- IEA Electricity Market Report Update 2023 https://www.iea.org/reports/electricity-market-report-update-2023
- Hydropower https://en.wikipedia.org/wiki/Hydropower
- Installed global hydropower capacity could reach 1,200 GW in 2022, https://www.hydroreview.com/hydro-industry-news/new-development/installed-global-hydropower-capacity-could-reach-1200-gw-in-2022-report-says/