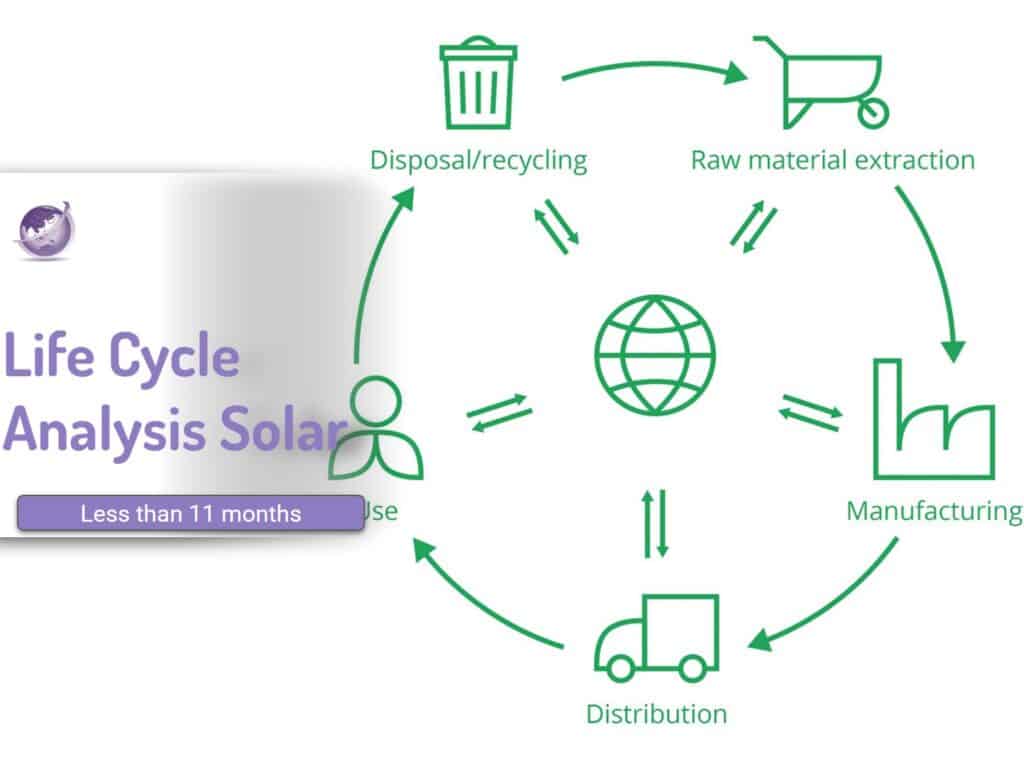
LCA or Life cycle analysis for solar panels and inverters has been done by a number of companies and research institutions to know if a renewable energy system is as green as they are made out to be. Fraunhofer Institute did an LCA on a Fronius inverter model GEN24 PLUS in a system. They concluded carbon was fully recovered in less than 11 months, in Sydney, Australia. The system included 10kW pv panels. With 8kW of Maxeon panels LCA payback was 0.52 years.
- Maxeon panels last 40 years and still produce at 85%
- Aust Recycled – see Recycling Solar Panels and Wind Turbines – sustainable technology (optimisticstorm.com)
- Carbon +ve in 11 months
- $$ payback 2.9 years
- 3.1 million AU households have solar and expecting to be 6 million by 2030
- 50% Aus electricity capacity = 17GW, where total of the 100 NEM generators name plate generation is 55GW and average used daily is about 30GW
Life Cycle Analysis of Various Energy Sources
| Fuel Source | gCO2e/kWhe | Notes & Explanation |
|---|---|---|
| Wind | 5-8 | Most emissions from construction steel and concrete |
| Nuclear | 6-110 Uo to 200 | Mining and enrichment markedly change emissions. As rich ore bodies are mined out, more energy is needed for less rice ore bodies. 80 years of supply left. |
| Solar | 38 | Using Maxeone 40 year panels and Fronius inverter 8kW |
| Gas | 500 | Fossil methane |
| Oil | 800 | Bunker oil and oil fired boilers induce a range of other pollutants |
| Coal | 1000 | Calculation of emissions from mining may underestimate total emissions by 2 or more times |
Life cycle analysis for Solar panels and Inverters?
Life cycle is based on the whole process
- The production phase (including sourcing of raw materials)
- The use phase
- The End-of-Life (EoL) phase

LCA of Inverter in System

Life Cycle Analysis of PV Cells
SolarQuote reports on Maxeon, a panel they sell. They quote Maxeon’s panels sustainability report. Maxeon engaged an external consultant to carry out an assessment of the Maxeon 3’s’ energy payback time (EPBT). This included the cumulative energy demand (CED) over all life cycle stages of the panel and considered local grid efficiencies for different locations around the world.
Maxeon 3 solar panels were determined to have an energy payback time of less than a year; ranging from 0.13 – 0.45 years for ground-mounted modules (50MW installation) and 0.27 – 0.92 years for 8kW residential rooftop systems. In Australia (Sydney), the EPBT was 0.26 years for the ground mount system and 0.53 years for the rooftop installation.
Conclusion
Using electricity from a PV system with a Symo GEN24 10.0 Plus in Australia would induce an average carbon footprint of 38.0 g CO2-eq/kWh. In comparison, using electricity from the Australian grid mix would result in a carbon footprint in the range of 600-1000 g CO2-eq/kWh (approx. 15-25 times higher, due to coal use, among other things). In comparison, as a rough estimation,
- CO2 emissions saved by the whole PV system over 20 years (not only the inverter) are equivalent to approx. 600 planted trees.
- Assume gasoline cars with average use of 5 l/100 km.
- Based on the ecoinvent database, the benefit of a PV system using the Fronius Symo GEN24 Plus 10.0 in Australia for 20 years (benefit of the whole PV system, not just that allocated to the inverter) would save the CO2 emissions equivalent of approx. 1,800,000 km travelled by car.
- For the same PV system use scenario, there would be a CO2 emissions saving equivalent to approx. 100 roundtrip flights Vienna-New York18.
References
- Maxeon Panel Sustainability Report https://mediaroom.maxeon.com/2022-06-30-Maxeon-Solar-Technologies-Releases-2021-Sustainability-Report-with-Energy-Payback-Time,-Long-Term-Targets
- Average based on: https://www.electricitymap.org/map,
- Ecoinvent = https://www.cleanenergyregulator.gov.au/NGER/National%20greenhouse%20and%20energy%20reporting%20data/Data-highlights/2020-21-published-data-highlights
- Nam et al. 2016: “Allometric Equations for Aboveground and Belowground Biomass Estimations in an Evergreen Forest in Vietnam” (https://www.ncbi.nlm.nih.gov/pmc/articles/PMC4910975/)