There are some who say there is no evidence of increasing renewable energy in spite of billions of dollars invested and those who dispute climate change. The evidence for the increasing share of energy consumption is in most countries in the world. While there is much greenwashing, there is also very solid and significant changes happening. For a view on China, check out the article and even there, renewable energy is the overwhelming major new electricity.
Evidence of increasing renewable Energy from Australia
The Australian AEMO’s quarterly release includes these highlights.
- Wind and grid-scale solar output increased 743 megawatts (MW) from Q1 2021 levels to a new quarterly record of 4,190 MW
- Increases in small-scale solar (460 MW), gas (271 MW) and hydro (42 MW).
- Declines in brown coal (304 MW)
- Decline black coal generation (374 MW) which hit its lowest Q1 average in two decades.
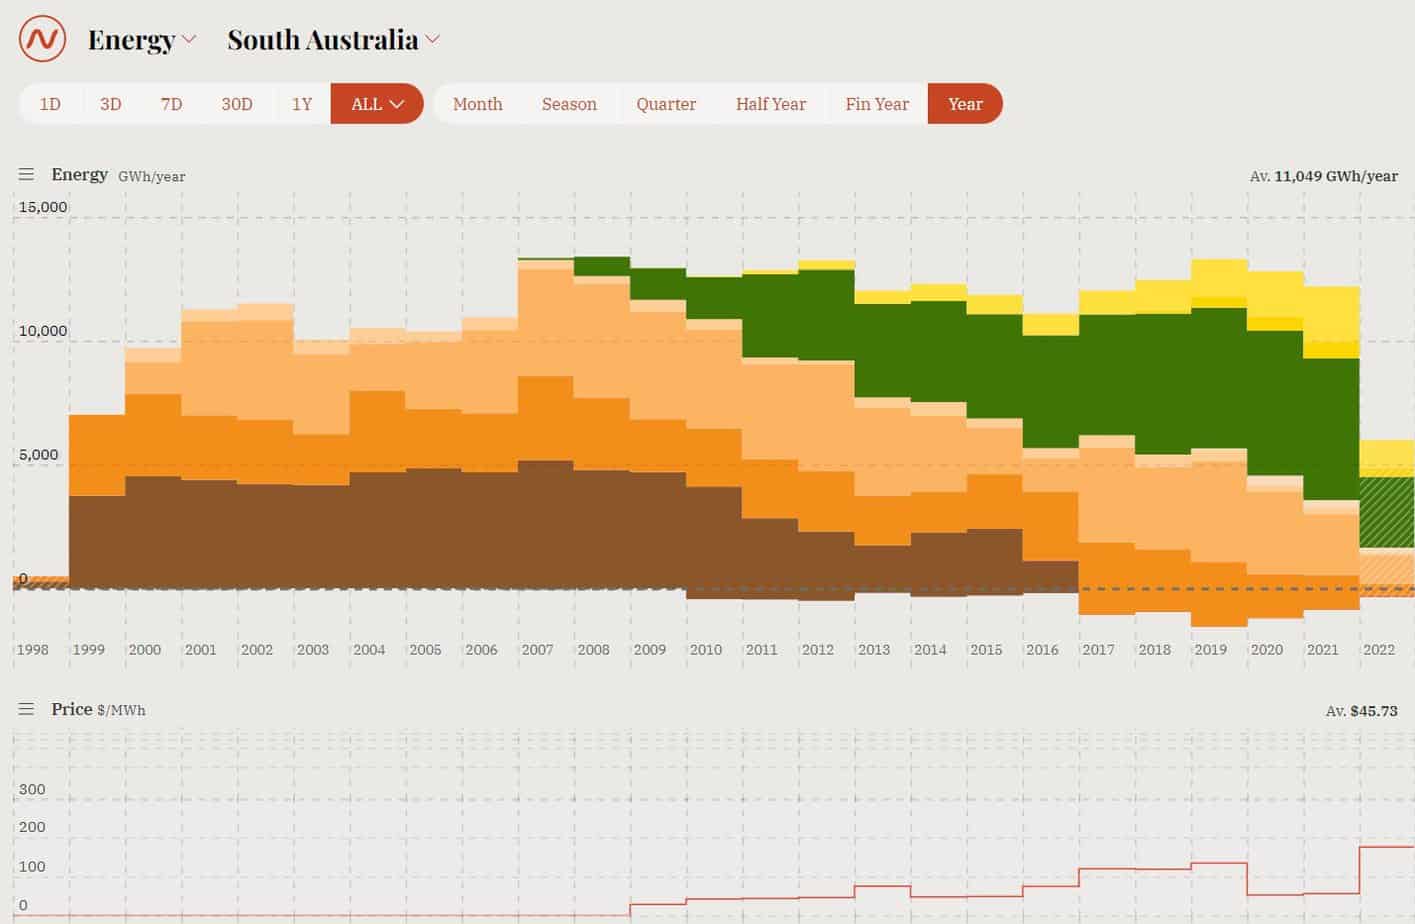
South Australia Transition over 2 decades
- Coal gone by 2017
- Renewables in 2022 is 68.2%
- Gas going, going, gone 2030?
- Net Exporter
- Exports=1,500, Imports 750 GWh/yr
- Battery ~ 100GWh/yr
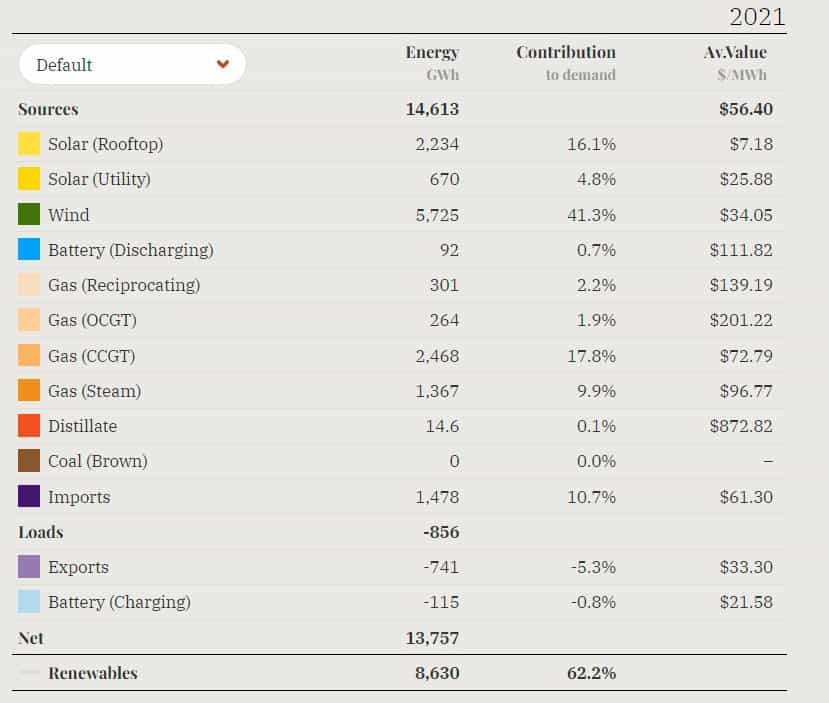
Renewables provided 62% in 2022
There was about 1500 imported and 700 exported via the link to Victoria. Imports would be coal fired based and exports renewable based. With multiple new solar and wind farms planned for the Goyder Renewables Zone The Zone has received development approval for 1,200MW of wind, 600MW of solar and 900MW of battery storage capacity, making it South Australia’s largest renewable energy project. Additionally, there is over 6,000 GW planned for a H2 project.
Increasing Household Rooftop Solar Generation
Those projections have continued to rise with the actual dis

Draft 2020 Integrated System Plan’s (ISP) Central scenario and at a rate closer to that projected in the High DER scenario. For the 2019 year, 219 MW of solar PV was added to the network. (AEMO Fact Sheet 2020)
Renewable Energy Exceeded Deman on 180 days

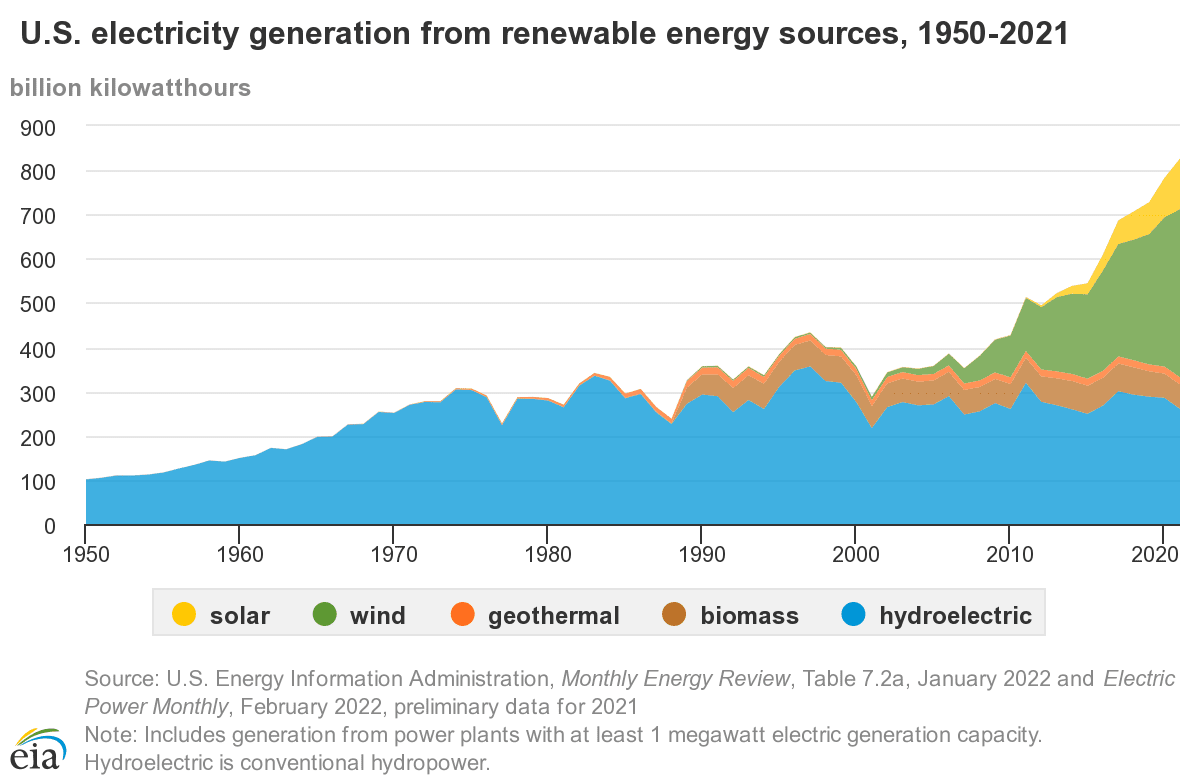
USA Evidence of Increasing Renewable Energy
The change is underway. Texas generated over 20% by land based wind in 2021 with its 24GW of capacity. Almost all new US power plants built in 2021 were carbon free, and gas will supply just 16 percent of new power plants as cheap wind and solar power take over the market. (U.S. Energy Information Administration)

New Power Plants in USA
In USA, the new power plants are now mostly renewable energy.
- Solar=40%
- Wind=31%
- Gas=16%
- These figures are only for large scale systems where about 19GW of large scale solar was installed and 4GW of household solar, but that figure is expected to double to 44GW of solar in 2022
- The USA has over 200GW of renewable energy in 2021 (American Clean Power Association).
- 17 GW installed in 2021 ($39B investment)
- 2.6GW of batteries installed.
- Texas = 7.4 GW
- California = 2.7 GW
- Oklahoma =1.5 GW
- Florida =1.4GW
- New Mexico = 1.4GW
Texas also surpassed other states in the amount of storage it has under construction or in advanced development, reaching nearly 20 GW, followed by California at nearly 14GW.
What Type of Renewable Energy
What Will Energy Consumption Look Like in a Decade?

Electrification Of Transportation
In Europe and China the change is happening, or in California in the USA.
- Germany – 26% of new cars are electric (14.3% battery electrics (BEVs) and 11.3% plugin hybrids (PHEVs). BEVs share is increasing over PHEVs.
- Norway 94% of new cars are electric
- USA, 6%, but over 34% of the luxury segment (Tesla dominates) but in California,
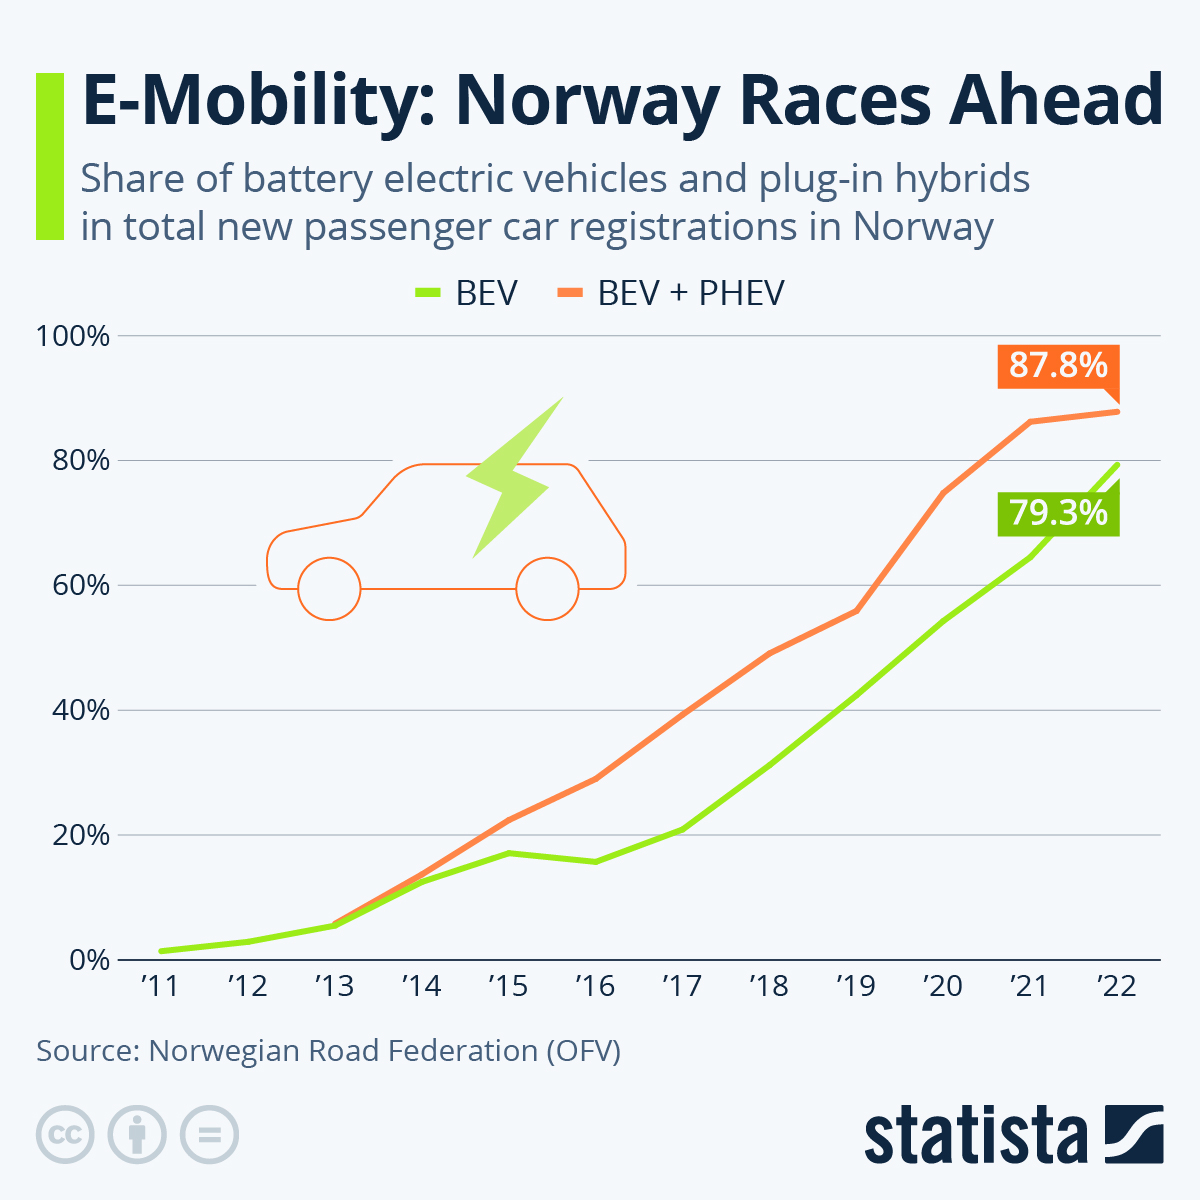
EVs in California Risen from 3% to 25% in 2022