The demand for renewable energy sees pv panels supply booming in USA, China, India and multiple countries. The rise indicates that solar installations are now in an exponential phase, as forecast by Tony Seba of RethinkX in 2013
India
India is funding local production with about 40GW currently, although much of the components are sourced from overseas. Their target of 60GW would enable them to meet their national goal of over 200GW capacity by 2030.
China
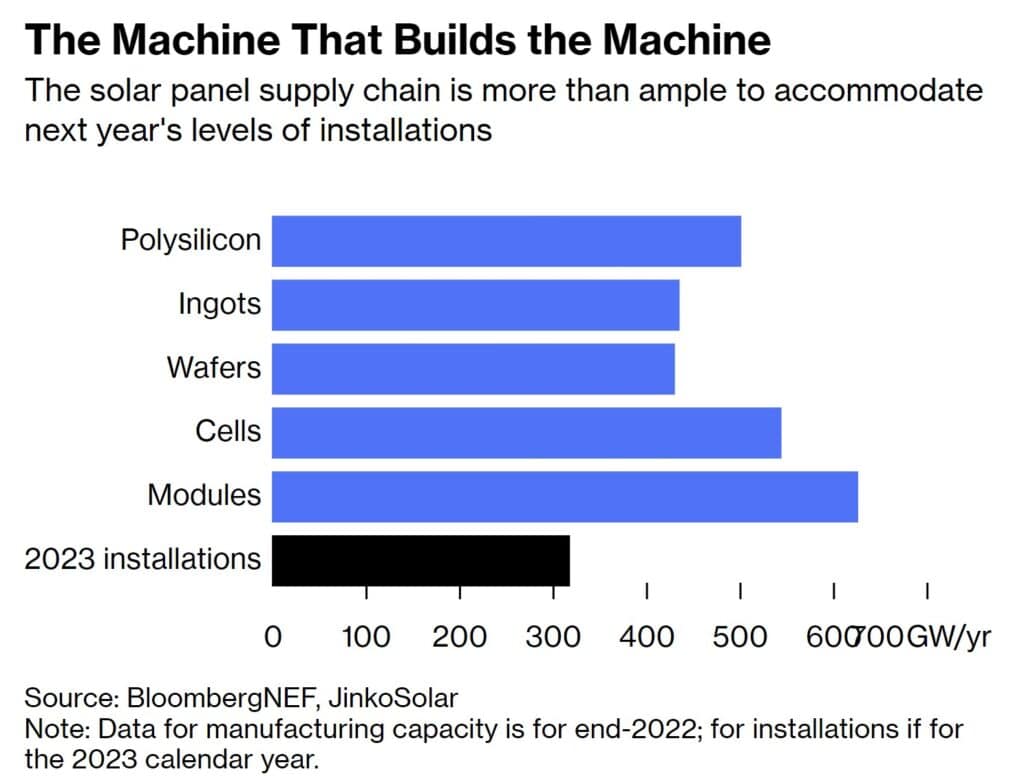
The remarkable increase in supply and installations across China continues with 510 GW of installed PV capacity at the end of August 2023. New manufacturer FuturaSun started building a 10 GW solar cell factory in Jiangsu province.


2000: more than a year, 2010/11: two weeks 2015: one week Now: less than a day
Chinesese Manufacturing Capacity Booming

EU and ROW
A few other countries have small boutique PV panel production. In context, every GW of panels produced reduces fossil fuel use in electricity production and in 2023 CO2 emissions from coal and gas will start to decline. Many countries have small or boutique manufacturers or assemblers. Many are considering building their own for sovereigty but it needs money time and supply chains.
| Country | Production | Notes |
|---|---|---|
| Europe | Mostly R&D | List of top 10 solar mfts |
| Turkey | 4th largest in world | Behind Vietnam and Sth Korea |
| Australia | Tiny. 1 factory in Sth Australia | Although invented in australia, production went to China |
USA PV Solar panels supply booming
President Joe Biden signed the IRA in August 2022. In just 12 months over 51 solar factories have been announced or expanded in the US. The investment from IRA exceeds $20 billion that flows into US communities
New production capacity across the solar supply chain is more than 155 gigawatts (GW). USA production includes:
- 85 GW of solar panel capacity
- 43 GW of solar cells
- 20 GW of silicon ingots and wafers
- 7 GW of inverter capacity . (Reuters)

600 GW Installed in 2024?

Which Countries Produce PV panels

Panel Prices Fall 25% in 2023

PV Exchange Aug 2023
PV Panels Swansons Law
Panel prices come down faster than predicted.

Changing Type

PV Efficiency
Conversion efficiency isn’t the full story. Yes, conversion efficiency doubled (~10% -> 20%) in the last 20 years, but silicon use per watt fell by 87%! (16g/W -> 2g/W). Longi now has cells that use just half a gram per watt and are 26% efficient. At 1.9 W/g (1.2 horsepower/pound), they’re more power dense than most combustion engines!
Glass/glass bifacial panels solve the degradation issues of plastic back sheets. And they harvest light from both sides which increases output in cloudy conditions (higher % diffuse light vs directional). That’s way more valuable than just the increase in overall output because it means more power when it’s needed most. Larger format panels may not seem revolutionary, but they lower balance of system and labor costs.
Even the production of silicon itself is getting more efficient. We use less energy to refine silicon today and get more watts and more watt hours from that silicon.

Sources and References
- How solar has exploded in the US in just a year – in numbers https://electrek.co/2023/08/13/solar-us-ira/
- List of photovoltaics companies Wikipedia
- Top 10 PV manufactures 2022 https://www.blackridgeresearch.com/blog/top-solar-pv-module-panel-manufacturers-companies-suppliers-producers
- VDMA ITRPV Report 2023 Key Findings and Report (https://www.vdma.org/international-technology-roadmap-photovoltaic)
Top 20 China Solar Panel Manufacturers
| Company | Capacity (GW) | Market Capitalization (USD Billions) | Website |
|---|---|---|---|
| LONGi Green Energy Technology Co., Ltd. | 185 | 47.9 | LONGi |
| Trina Solar Co., Ltd. | 160 | 22.9 | Trina Solar |
| JinkoSolar Holding Co., Ltd. | 155 | 19.9 | Jinko Solar |
| JA Solar Holdings Co., Ltd. | 145 | 21.8 | JA Solar |
| Canadian Solar Inc. | 20 | 7.3 | Canadian Solar |
| Hanwha Q CELLS Co., Ltd. | 19.1 | 11.5 | Q CELLS |
| First Solar, Inc. | 9.4 | 11.2 | First Solar |
| Astronergy Co., Ltd. (CHINT SOLAR) | 16 | 4.7 | CHINT SOLAR |
| Risen Energy Co., Ltd. | 15 | 6.1 | Risen Energy |
| Suntech Power Holdings Co., Ltd. | 12 | 3.3 | Suntech |
| Maxeon Solar Technologies | 10 | 11.9 | Maxeon Solar |
| REC Group | 5.4 | 6.3 | REC Group |
| Silfab Solar | 4.5 | 1.5 | Silfab Solar |
| Mission Solar | 4.3 | 1.3 | Mission Solar |
| Hyundai Energy Solutions | 4.1 | 1.2 | Hyundai Energy Solutions |
| Phono Solar | 3.9 | 1.1 | Phono Solar |
| Seraphim Energy Technology Co., Ltd. | 3.7 | 1 | Seraphim |
| TrunSolar Co., Ltd. | 3.5 | 0.9 | TrunSolar |
| Meyer Burger Technology AG | 3.4 | 1.5 | Meyer Burger |
| BYD Company | 3.3 | 150 | BYD |
| Total | 782.6 | 183.3 |
References – pv-tech.org: https://www.pv-tech.org/
Google Finance: https://www.google.com/finance


