Global car sales were expected to grow to around 66 million automobiles in 2021, up from an estimated 63.8 million units in 2020. The sector experienced a downward trend on the back of a slowing global economy and the advent of the coronavirus pandemic in all key economies. The data provided below is from 2020, as many car manufacturers wont release their 2021 data until Feb 2022.

The latest result from Tesla who increased electric car production from 0.45m to just under a million and who have 2 more factories to come online in 2022, and the rapid expansion of over 240 electric vehicle manufacturers in China will have a major impact on existing car manufacturers. The question remains – if Tesla produces 4 million sales per year in 2025, and SAIC changes to EV, who survives a 30% reduction in revenue?
Electric Car Sales
To understand the change in the car industry, November 2021, over 721,000 EV new passenger plug-in electric cars were registered during the month, which is 72% more than a year ago and a new monthly high. (According to EV-Volumes data) and market share of battery EVs increased to 11.5% of total sales (518,000) or about 6m per year. Total car sales have been between 70 and 80 million per year. Hybid vehicles are slowing.
Global Car Sales Data
The following table has been constructed from a variety of sources (Organisation Internationale des Constructeurs d’Automobiles), Statista, Companies Market Cap, Yahoo Finance, Y Charts
| Group | Sales | Rev $B | EBITDA $B | 3Cap (B) | Debt $B | Invest (3yr) | PE | Op Margin % |
|---|---|---|---|---|---|---|---|---|
| Toyota | 9,529,000 | 249.4 | 6.1 | 258 | 182 | 99.3 | 9.4 | 8.08 |
| Volkswagen | 9,306,000 | 254.1 | 51.0 | 130 | 227 | 497 | 7.0 | 6.38 |
| Stellantis | 6,915,000 | 98.8 | 16.4 | 61 | 76 | 35 | 7.8 | -1.92 |
| GM | 6,828,000 | 122.5 | 27.0 | 88 | 110 | 77 | 8.1 | 7.43 |
| Hyundai-Kia | 6,406,000 | 88.1 | 12.3 | 28 | 91 | 209 | 4.4 | 5.68 |
| SAIC Motor | 5,601,000 | 106 | 0.05 | 37 | 163 | 91 | 22.5 | |
| Honda | 4,399,000 | 121.8 | 1.8 | 49 | 112 | 198 | 6.0 | 5.01 |
| Ford | 4,187,000 | 127 | 16.0 | 87 | 145 | 21.7 | 12.4 | 7.17 |
| Daimler AG | 2,841,000 | 175.9 | 16.7 | 83 | 169 | 20.0 | 6.3 | 11.19 |
| Suzuki | 2,448,000 | 4.0 | 19 | 6.6 | 35 | 11.8 | ||
| BMW Group | 2,325,000 | 112.8 | 22.0 | 67 | 113 | 4.6 | 10.0 | |
| Geely | 1,321,000 | 14 | 6.9 | 27 | 6 | 33.7 | ||
| Mazda | 1,244,000 | 31 | 2.1 | 6 | 15 | 11.3 | ||
| Great Wall | 1,116,000 | 62 | 8.9 | 56 | 27.4 | |||
| Subaru | 885,000 | 34 | 14 | 0 | 11.6 | |||
| Tata | 835,000 | 102 | 0.2 | 25 | 10 | -34.0 | ||
| Tesla | 980,000 | 54 | 9.6 5 (Q1/22) | 1,200 | 0.1 | 11 | 88.0 | 19.2 |
| Ferrari | 9,200 | 4.86 | 0.01 | 4 | 48.0 | 24.4 | ||
| Aston Martin | 3,400 | 0.6 | 2 | -4.6 | ||||
| McLaren | 2,900 | 0.78 | 1 | |||||
| BYD | 426,000 | 24 | 123 | 49 | 35.0 | |||
| Rivian | 920(2021) 10,000(2022) | 0 | 0.0 | 90 | 0.18 | 4.6 | ||
| Lucid | 300(2021) 12,000(2022) | 0 | 68 | 0.216 | N/A |
There are a large number of other car manufacturers. E.g. There are over 240 EV companies in China alone making EV cars. Some of the new entrants (Rivian, Lucid) have high market cap but don’t yet have any major sales. Others have production and low market cap.
Some of debt is vehicle lease and inventory.
USA Vehicle Sales 2021
For a breakdown of 44 USA vehicle sales by brand, check out this article in Forbes. Top selling brand was Toyota with 2m sales, followed by Ford 1.8, GM 1.4, Honda 1.3, Nissan 0.9. Tesla had got to 13th on the top sellers with 352k total, up 71% from 2020 to 2021. With Gigafactory coming on line, it would be entirely likely to be number 1 by 2024.
Tesla Forecast Car Sales Data
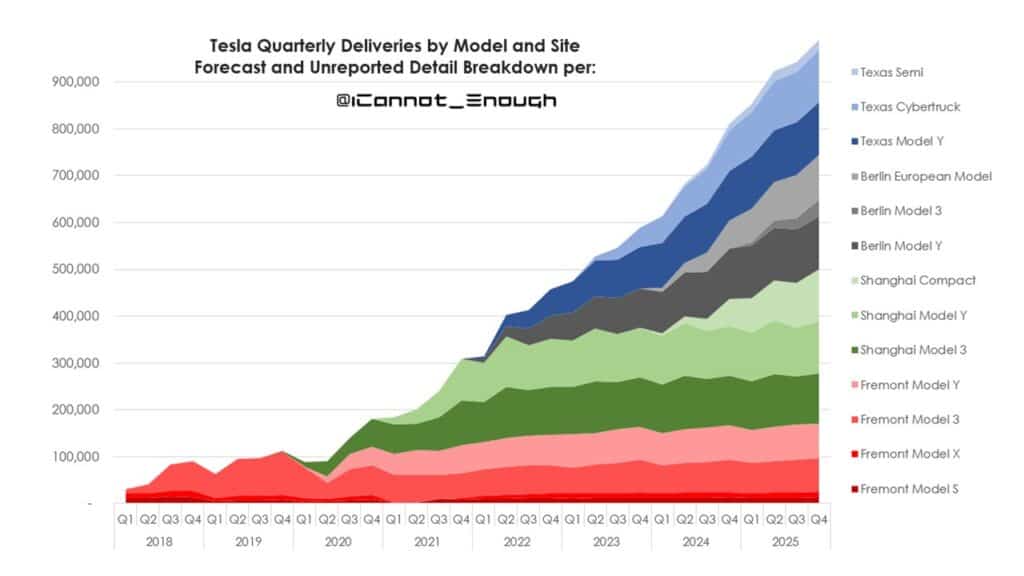
The forecast from James Stephenson (Twitter) suggests that in 3 years, Tesla will be the biggest in revenue and margin of all car companies. In 2021, Tesla had more net income (6.6B) than Ford (4.5B). While Ford sold more than 4 times the number of vehicles, Tesla delivered 50% more operating profit on a much smaller operation. Expect that change to accelerate in 2023.


Global Car Production by Country
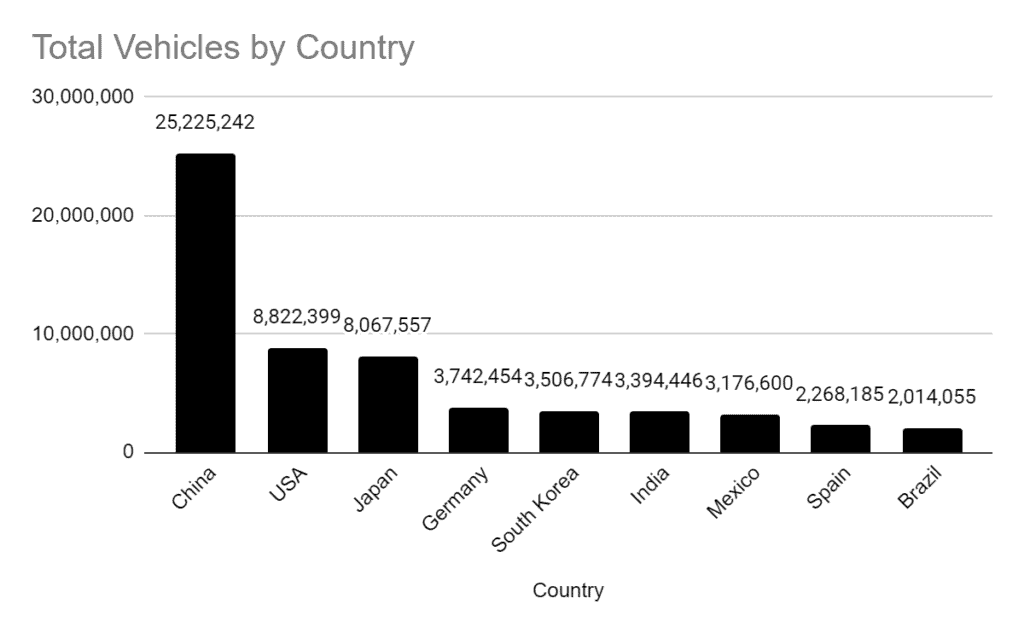
Much of the media is based around the USA, but China is 30%, EU about 11% and USA 11%. Just 10 countries account for about 80% of all cars.
| Rank | Country | Cars | Commercial | Total | % |
|---|---|---|---|---|---|
| 1 | China | 19,994,081 | 5,231,161 | 25,225,242 | 32% |
| 2 | USA | 1,926,795 | 6,895,604 | 8,822,399 | 11% |
| 3 | Japan | 6,960,025 | 1,107,532 | 8,067,557 | 10% |
| 4 | Germany | 3,515,372 | 227,082 | 3,742,454 | 5% |
| 5 | South Korea | 3,211,706 | 295,068 | 3,506,774 | 5% |
| 6 | India | 2,851,268 | 543,178 | 3,394,446 | 4% |
| 7 | Mexico | 967,479 | 2,209,121 | 3,176,600 | 4% |
| 8 | Spain | 1,800,664 | 467,521 | 2,268,185 | 3% |
| 9 | Brazil | 1,608,870 | 405,185 | 2,014,055 | 3% |
| 10 | Russia | 1,260,517 | 174,818 | 1,435,335 | 2% |
| 11 | Thailand | 537,633 | 889,441 | 1,427,074 | 2% |
| 12 | Canada | 327,681 | 1,048,942 | 1,376,623 | 2% |
| 13 | France | 927,718 | 388,653 | 1,316,371 | 2% |
| 14 | Turkey | 855,043 | 442,835 | 1,297,878 | 2% |
| 15 | Czech Republic | 1,152,901 | 6,250 | 1,159,151 | 1% |
| 16 | United Kingdom | 920,928 | 66,116 | 987,044 | 1% |
| 17 | Slovakia | 985,000 | 985,000 | 1% | |
| 18 | Iran | 826,210 | 54,787 | 880,997 | 1% |
| 19 | Italy | 451,826 | 325,339 | 777,165 | 1% |
| 20 | Indonesia | 551,400 | 139,886 | 691,286 | 1% |
| 21 | Malaysia | 457,755 | 27,431 | 485,186 | 1% |
| 22 | Poland | 278,900 | 172,482 | 451,382 | 1% |
| 23 | South Africa | 238,216 | 209,002 | 447,218 | 1% |
| 24 | Romania | 438,107 | 438,107 | 1% | |
| 25 | Hungary | 406,497 | 406,497 | 1% | |
| 26 | Uzbekistan | 280,080 | 280,080 | 0% | |
| 27 | Belgium | 237,057 | 30,403 | 267,460 | 0% |
| 28 | Portugal | 211,281 | 52,955 | 264,236 | 0% |
| 29 | Argentina | 93,001 | 164,186 | 257,187 | 0% |
| 30 | Morocco | 221,299 | 27,131 | 248,430 | 0% |
| 31 | Taiwan | 180,967 | 64,648 | 245,615 | 0% |
| 32 | Slovenia | 141,714 | 141,714 | 0% | |
| 33 | Austria | 104,544 | 104,544 | 0% | |
| 34 | Finland | 86,270 | 86,270 | 0% | |
| 35 | Kazakhstan | 64,790 | 10,041 | 74,831 | 0% |
| 36 | Egypt | 23,754 | 23,754 | 0% | |
| 37 | Serbia | 23,272 | 103 | 23,375 | 0% |
| 38 | Ukraine | 4,202 | 750 | 4,952 | 0% |
| Others | 709,633 | 109,475 | 819,108 | 1% | |
| Total Globally | 55,834,456 | 21,787,126 | 77,621,582 | 100% | |
| Total Top 10 | 44,096,777 | 17,556,270 | 61,653,047 | 79% | |
| Top Top 20 | 51,633,117 | 20,918,519 | 72,551,636 | 93% | |
| Europe | 10,533,352 | 1,731,404 | 12,264,756 | 16% |
Car Production

The Best Selling Cars Globally
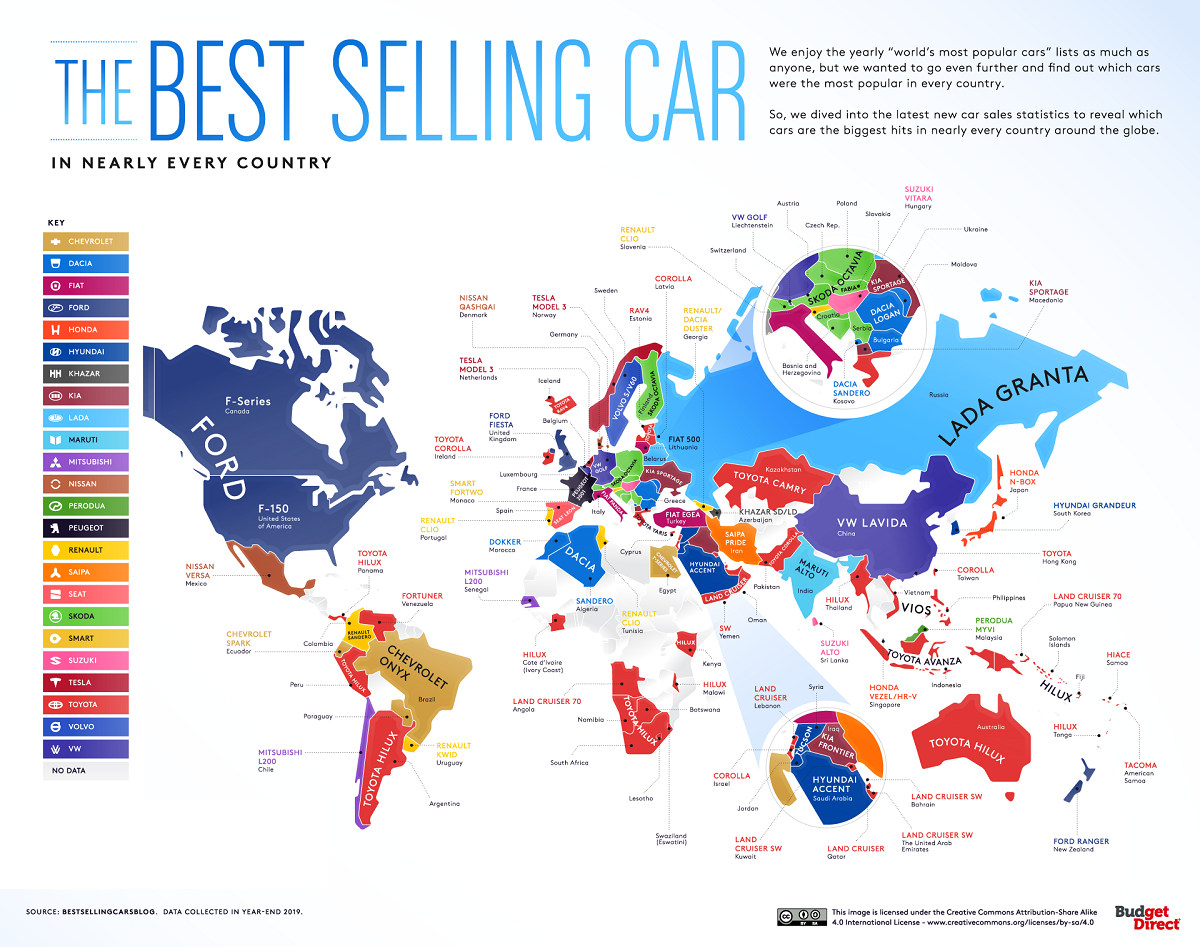
Every country has their favourite car. Check out the graphic below and their data from Visual Capitalist for 2019.
Toyota has the best-selling vehicle in 41 countries of the 104 countries tallied. The Hilux was the best seller in 16 countries, but trucks such as the Ford Ranger has joined that list of trucks being the top in 47 of the 104 countries listed.

Rising Car Companies
Do not disregard up and coming car manufacturers. They may not have the brand, but they are nimble and not bogged down in group think
Geely
Geely has a number of brands. In the USA, the group is represented by Volvo and Polestar, but it has a brand called Zeekr where in 2021 it produced just Geely intends to sell 1.65 million vehicles in 2022 (24% more than in 2021), excluding Volvo and Polestar, of which 100,000 are to be EV, and also to produce Zeekr for Waymo autonomous vehicles.
Vinfast
The Vietnamese company from Haiphong will be 100% by the end of 2022. Started in 2017, and designs by Pininfarina, it only sold about 50,000 in Vietnam but plans to sell in Europe and USA.
EV Vehicles for Cars and Pickups
Check out the latest article dealing with electric pickup vehicle manufacturers here and trucks here.
How Soon Will Manufacturers Move to EV
These are the plans for existing manufacturers in Nov 2021, but these change. Honda for example in 2020 said they would not move on EV for a decade. Six months later they revised their plans. Here is an Australian perspective in Nov 2021 by the Australian ABC| Company | 2021 Plan | Notes about their plans, which do change |
|---|---|---|
| Audi | 2026 New models | build their current gas, diesel, and hybrid models until the early 2030s. |
| Volvo | 2025 50% | All EV by 2030 |
| Ford | 2025 40% | Of global sales, and within EU will be 100% |
| Nissan | early 2030s | All new cars in Japan China and USA |
| VW | All by 2035 | Shortly after that in US and China |
| GM | All by 2035 | |
| Honda | 2040 | Hydrogen, hybrid. Only recently stated a change |
| Hyundai | 2040 | Revised, all R&D on ICE has stopped. |
| Tesla | 2012 | With current production of 1m, and 20m by 2030 |

Manufacturers and Models
| Group | Vehicle Brands |
|---|---|
| Toyota Motor | Daihatstu, Lexus, Toyota |
| Volkswagen | Audi, Bentley, Bugatti, Lamborghini, Porsche, RUF, Seat, Skoda, Volkswagen |
| Stellantis | Alpine, Avtovaz, Abarth, Alfa Romeo, Chrysler, Citroen, Dodge, DS, Fiat, Infiniti Jeep, Lada, Lancia, Maserati, Nissan, Opel, Peugeot, Ram, Renault, Samsung, Vauxhall, Venusai |
| GM | Buick, Cadillac, Chevrolet, GMC |
| Hyundai-Kia | Genesis, Hyundai, Kia |
| SAIC Motor | Maxus, MG, Roewe, Yuejin |
| Honda Motor | Acura, Honda |
| Ford | Ford, Lincoln |
| Daimler AG | Mercedes-Benz, Mercedes-AMG, Smart |
| Suzuki | Suzuki |
| BMW Group | BMW, Mini, Rolls Royce |
| Geely | Geely, Lotus, Lynk&Co, Polestar, Volvo |
| Mazda | Mazda |
| Great Wall Motors | Great Wall, Haval, Ora, Tank, Wey |
| Subaru | Subaru |
| Tata | Jaguar, Land Rover, Range Rover, Tata |
| Tesla (2021) | Projected to 100B in 2022, 150 in 2023, and $300B by 2025 |
| Ferrari | Ferrari |
| Aston Martin | Aston Martin |
| McLaren | McLaren |
| BYD | |
| Rivian | |
| Lucid |


