That 100 companies responsible for 71% of emissions globally statistic has been widely circulated. E.g. The Guardian 2017 [1] and multiple others reported on the report from CDP [3]. The report also shows that these global-scale emissions are concentrated over a small number of producers. From 1988 to 2015, just 25 fossil fuel producers are linked to 51% of global industrial GHG emissions.
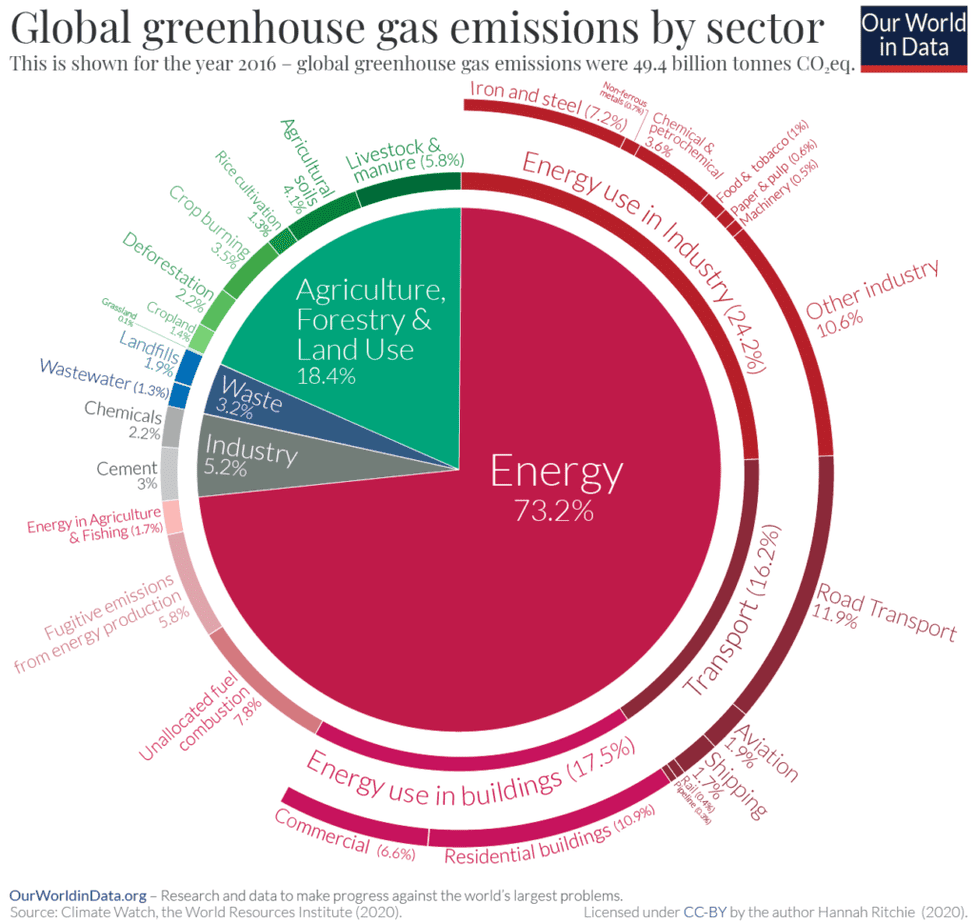
The headline should read 100 companies are responsible for 71% of fossil fuel emissions. Global emissions also come from agriculture and land use. However 73% of energy is from fossil fuel. Nuclear and hydro electricity are low emission. Scope 3 emissions in transport, electricity generation, use of gas and coal in steel and cement production are the majority. The breakdown of emissions by sector is below.

All fossil fuel company operations and products worldwide have released more emissions in the last 28 years (to 2016) than in the 237 years previously
- 833 GtCO2e in the 28-year period from 1988 to 2015
- 820 GtCO2e in the 237 years between 1988 and the birth of the industrial revolution, measured from 1751.
- Including all historical years of data2, the database captures nearly one trillion tonnes (923 billion) of GHGs from the 1003 producers, which amounts to 52% of all industrial GHGs ever emitted.
Who Are Those 100?
The highest emitting companies over the period since 1988 include:
- Public investor-owned companies such as ExxonMobil, Shell, BP, Chevron, Peabody, Total, and BHP Billiton;
- State-owned entities such as Saudi Aramco, Gazprom, National Iranian Oil, Coal India, Pemex, CNPC and Chinese coal, of which Shenhua Group & China National Coal Group are key players.

Objections or Clarification
Some objections from various sources object to 4 aspects.
1. Scope: The data refers specifically to greenhouse gas emissions from fossil fuel production between 1988 and 2015, not total global emissions.
2. Responsibility vs. Contribution: Attributing responsibility for climate change solely to these companies is complex and can be misleading. While they contribute significantly through production, consumer demand and systemic factors also play crucial roles.
3. Data Source: The information comes from the “Carbon Majors Report 2017” by the CDP (formerly the Carbon Disclosure Project). However, it’s important to note that the report is several years old and may not reflect the latest data or industry changes.
4. Current Landscape: Many companies in the report, particularly larger ones, have made commitments to sustainability initiatives and emission reduction targets. The landscape is constantly evolving, and focusing solely on historical data without acknowledging these efforts can be inaccurate.
Coal Mines Tracker
The Global Energy Monitor monitors the 3200 operating coal mines (4300 coal mines). They identify over 2000 owners, 7.9b tonnes in over 70 countries. The most recent release of this data was in October 2023 and includes operating mines producing 1 million tonnes per year or more, with smaller mines included at discretion. The tracker also includes proposed coal mines and mine expansions with a designed capacity of 1 million tonnes per year or more.

Oil and Gas
The top 10 oil and gas companies include
| Company | Revenue (USD Billion) | Net Income (USD Billion) | Market Cap (USD Billion) | 1-Year Trailing Total Return (%) | Exchange |
|---|---|---|---|---|---|
| Saudi Arabian Oil Company (Saudi Aramco) | 590 | 156 | 1.8 | -3.7 | Saudi Arabian |
| PetroChina Co., Ltd. (PTR) | 416.91 | 30.72 | 351.08 | -18.18 | HKG |
| Exxon Mobil Corporation (XOM) | 285.64 | 23.04 | 387.55 | 75.51 | USD |
| Shell plc (SHEL) | 272.66 | 20.64 | 280.59 | 44.95 | GBP |
| TotalEnergies SE (TTE) | 184.63 | 18.06 | 152.97 | 36.83 | EUR |
| Chevron Corporation (CVX) | 155.6 | 15.6 | 335.35 | 65.02 | USD |
| BP plc (BP) | 157.74 | 7.57 | 89.63 | 24.9 | GBP |
| China Petroleum & Chemical Corporation (SNP) | 448.71 | 20.88 | 230.1 | -13.68 | CNY |
| Marathon Petroleum Corporation (MPC) | 120.93 | 4.18 | 48.73 | 74.32 | USD |
| Valero Energy Corporation (VLO) | 113.98 | 3.34 | 52.89 | 84.57 | USD |


More Reading
- Just 100 companies responsible for 71% of global emissions, study says 2017. Guardian https://www.theguardian.com/sustainable-business/2017/jul/10/100-fossil-fuel-companies-investors-responsible-71-global-emissions-cdp-study-climate-change
- New report shows just 100 companies are source of over 70% of emissions CDP 2017 https://www.cdp.net/en/articles/media/new-report-shows-just-100-companies-are-source-of-over-70-of-emissions
- The Carbon Majors Database CDP Carbon Majors Report 2017 https://cdn.cdp.net/cdp-production/cms/reports/documents/000/002/327/original/Carbon-Majors-Report-2017.pdf
- Climate Action Tracker: Tracks government climate action and measures its effectiveness in achieving the Paris Agreement goals. (https://climateactiontracker.org/)
- The IPCC Sixth Assessment Report: (https://www.ipcc.ch/reports/)
- Top ten countries currently developing the most oil and gas fields June 2023 https://www.energymonitor.ai/sectors/industry/top-ten-countries-developing-the-most-oil-gas-fields/
- No, 100 corporations do not produce 70% of total greenhouse gas emissions. 2022 https://www.politifact.com/factchecks/2022/jul/22/instagram-posts/no-100-corporations-do-not-produce-70-total-greenh/
- Environmental Protection Agency, Global Greenhouse Gas Emissions Data, accessed July 20, 2022
- Paul Griffin, Richard Heede, Ian van der Vlugt, The Carbon Majors Database Methodology Report, 2017
- Climate Watch, Global Historical Emissions from the Potsdam Institute for Climate Impact Research, accessed July 21, 2022
- Snopes, Only 100 corporations responsible for most of world’s greenhouse gas emissions?, 2021 https://www.snopes.com/fact-check/corporations-greenhouse-gas/
- Emissions by sector: where do greenhouse gases come from? https://ourworldindata.org/emissions-by-sector


